
Extra Disclaimer – First, we want to emphasize the speculative nature of our forecasts and these markets, in particular, with their very high level of volatility. We definitely could be wrong. Also, implementation is another risk factor. We believe the markets will continue to be very risky with huge price moves up and down for a time – making it very difficult to not lose money, unfortunately. We believe emotionally charged markets like these increase the difficulties of being successful. As always, past success, of ours or anyone else’s, does not guarantee future results. Please read all the disclaimers all over our website. Be careful and be safe.
Introduction – This blog (in reverse chronological order below) will document and discuss our forecast for the Resumption of the unfortunately very very large economic contraction. This time we will include all the previous elements of the older blogs (- Deflation Watch – Elements of Market Tops– Major Trend Changes ) (where we forecasted the 2006-2007 major Housing Bubble top and the Financial Crash bottom in 2009) into the “The Contraction Resumes” and, then into this blog, “Calling The Super All-Everything Top” for the super top that we believed peaked in late 2021/very early 2022.
Also, see our Annual Forecasts where we Forcasted the 2000 Tech Top (before we were blogging) and several of the market bottoms: Tech Wreck & Financial Crash bottom.
Please note that, as we’ve discussed before, tops are usually rounded with various indices and media discussions occurring spread out over a longer time period than bottoms where they all spike down to the low together. Also note, the size of a rebound generally indicates the period of time required for all the various areas to top; thus, a very large top takes a long time to put itself in place. For example, the 2000 equity top actually saw some indices topping back as far as 1998 and as late as late 2000; the 2006/2007 Housing Bubble (and equities) top was actually spread out over four years. With that said, this downturn will almost certainly be just as large and we think even larger, unfortunately.
The Reverse Chronological Commentary Starts Here (directly below):
__________________________________________________
11-06-2023 – Market Update – We’ve been on a roll. So, the Lower Lows we forecasted in both the Bond Market and the Equity Markets happened in Late October 2023 – on 10-27-2023 in most indices like the Dow Jones Industrials and the S&P 500. A very notable Lower Low was in the Russell 2000 on 10-22-2023 which was as low as it was back on 11-1-2020, about 3 years ago.
Of course, we haven’t been forecasting a market that is going straight down but a Series of Lower Lows and Lower Highs. And, right now, equity indices have since been rebounding sharply (which is normal in Bear Markets – see our Analysis for the Tech Wreck (2000-2003) and also for the Financial Crash (2007-2009)); and we are forecasting that, like previously, even though the current rebounds are sharp and sizeable, we are experiencing Lower Highs – notably lower than the All-time Highs around December 2021 through January 2022, documented numerous times – and lower than some other lows. In fact, we think we are at around the appropriate levels for Lower Highs to be put in right about now/here. We could have some large drops and another set of rebounds but not much above current levels – either way, then we expect we will be off to the races for new notable Lower Lows in equities. At some point, we expect an accreleration downwards in equity prices with downlegs notably longer than sharp counter-trend rebounds – This is what happened in previous Equity Bear Markets that we documented.
Bonds – Similarly, the high grade bond market; well, the yield of the U.S. Thirty Year Long Bond traded up and above 5% for the last half of October 2023 (Lower Low in prices) before the current large 20+ basis points rally (new Lower High in price). Most of the curve performed similarly except the short end which saw less movement. As before, we expect yields to now start moving back upwards notably (prices down), especially the long end of the yield curve working toward Un-Inverting the Yield Curve. Most people use the yield of 30 year Long bond to the the Two Year Treasury which is at a 4.94% but we will use the Three Month T-Bill which is at 5.44% to determine if the Yield Curve has a positive slope – that would be “more normal.” So, with the U.S. 30 Year yield currently at 4.81% (Lower High price) it has a notable way to rise in yield (down in price to a new Lower Low).
10-19-2023 – Market Update – This update is going to sound a lot like our Update from last month, except that the forecasted targets were hit but, the new forecast are essentially a continuation of the previous forecasts, all within our long term forecast framework.
Equities – Essentially all equity indices did put in new Lower Lows before rebounding a bit with the most recent new (renewed) “war” before putting in current, new choppy rebounds. Given our Long Term Outlook, we are forecasting more new Lower Lows and we believe eventually (and sooner rather than later) we will see dramatic drops in the equity indices. The leader of this category seems to be High Yield Municipal Bonds (proxy “HYD”), our old specialty! (Clark was the Portfolio Manager of “Vmpax” for 20 years ending mid-2010, which was originally in the High Yield Municipal category, until he moved it into the Short Term category). High Yield Muni proxy, “HYD,” has been dropping the most of the equity and/or equity-like indices we follow compared to previous lows. Following that category is Junk (taxable) bonds (proxy “JNK”), another of our old specialties (Clark was Portfolio of a Junk Taxable Bond fund for a concurrent 8 years). Yes, these are not equities and they do have a very large interest rate component but they are much more risky than high grade bonds – they have risky equity-like credit quality components & they seem to lead equities in the price cycles especially down from the tops. As for “pure” equities, the small caps (proxy Russell 2000, “RUT”) seems to be leading the other equity indices – it has also been heading downwards and seems to be about to break down to a new larger Lower Low. Thus, to us, the trend is down and we are expecting very large notable drops coming soon. Of course, “we will see.”
Interest Rates – As forecast, interest rates have continued to rise with the long end rising faster than the short end. We have been forecasting the reversing of the current yield curve inversion, by the long end trading off (interest rates up) more than the short end & that is what has been happening. In fact, all across the long end of the U.S. Treasury yield curve we are seeing new Record Higher High Yields (since the All-Time record lower lows a couple of years ago. The U.S. Treasury Long bond has seen its yield breach over 5% a couple of times over the past couple of days. We expect continued stair-stepping of yields of longer maturities until the curve is no longer inverted. The U.S. Treasury 3 month bill is currently at 5.42%! so the Long Bond, just to get the yield curve back to “flat” (or level), would need to rise around 42 basis points – We think a 6% Long Bond yield is very likely (and even higher after that).
Real Estate – Long term Housing Mortgage interest rates are now above 8% and we have read that “housing affordability” is the lowest since the late 1980’s – so almost 40 years. They showed a chart of it but it did not go all the way back into the 1970’s when we had the huge inflation that shot the real estate market up before it collapsed down into 1982 (the beginning of the Super Bull Market in Stocks that we think ended in late 2021 – about 3 years ago). I’ve not doubt that homes were very unaffordable at the 1979 real estate peak (that we have documented several times over the years) – we seem to be in a similar situation now.
Commodities – We are less confident on the direction of commodity prices right now, especially precious metals as they have had a bit of a breakout. However, they are largely financed and the cost of financing inventories of commodities has just gone up as we detailed above; thus, we still expect prices to tumble but are less certain.
10-16-2023 – Our Most Recent Tax-Free Performance – Similar to other recent previous months, the short term municipal bond market had another tough month but for the current twelve months, its total return rebounded because the month that dropped off had a more negative total return than the current month. As usual our performance was much more stable. So while the averages caught up a bit for the current twelve months, we are still far ahead for the longer periods.
Stamper Capital & Investments, Inc.
Separately Managed Accounts (National Tax-Free) vs. Tax-Free Municipal Bond Indices
Annual Total Returns, Period Ended 9-30-2023
| PERIOD | Morningstar Muni Short Category Average | SCI Separately Managed Tax-Fee Municipal Accounts Composite Net of Fees | SCI Separately Managed Accounts Net Pre-Tax Equivalent* | Bloomberg Barclay’s 3 Year Tax-Free Muni Bond Index |
|---|---|---|---|---|
| 1 Year | 2.36% | 2.68% | 4.12% | 1.94% |
| 3 Years | -0.43% | 1.75% | 2.69% | -0.95% |
| 5 Years | 0.80% | 2.04% | 3.14% | 0.89% |
| 10 Years | 0.86% | 1.95% | 3.00% | 0.97% |
| 15 Years | 1.42% | 2.25% | 3.47% | 1.73% |
| Since Inception (1/1/1995) | N/A | 3.64% | 5.60% | N/A |
Note: Indices do not have fees (trading costs, custody fees, management fees, etc.) deducted from their returns. We now have a much more reasonable index to compare to – the Bloomberg Barclay’s 3 Year Tax-Free Municipal Index. We still aim for similar or better returns with less risk – The key with this table is that our longer term pre-tax municipal bond returns are noticeably higher than the bond market index but with What We Think is less risk – we will see when rates start to rise and/or credit quality yield spreads widen.
Please see the Disclaimer and Footnotes at the bottom of the page for more information.
* at 35% Federal tax rate
9-24-2023 – Market Update – Equities – The new Lower Lows we mentioned we were looking for in our previous update arrived in essentially all equity indices we follow, with the Russell 2000 and the Dow Jones Transports leading the pack. Junk taxable bonds (proxy “JNK”) have also put in a new Lower Low and are following the High Yield Municipal Bond Market (proxy “HYD”) which seems to be leading all indices. The Housing Market (proxy “IYR”) and the Home Builders (proxy “ITB”) that we have been talking about also put in new Lower Lows. So, to us the current short term trend is downward. We expect new Larger Lower Lows shortly which would make the intermediate term be downward. If that happens we would not be surprised to see an acceleration in the downward trends.
Bonds/Interest Rates – We have recently seen all longer term U.S. Treasury yields put in Higher Highs – the 30 Year just barely and the Ten Year by quite a lot. We had talked previously about the Yield Curve Inversion and that we thought it would be resolved (to a more normal sloping yield curve with longer rates higher than shorter rates) by longer rates rising, not from shorter rates dropping. It looks to us that this breakout (upward in yields) all along the curve is the beginning of that change in yield curve shape. If this is true and long rates continue to go up (as we are forecasting), as we have discussed so many times in these pages, an ultimate impact will be declining prices of all things that are heavily financed which is pretty much everything these days. Of course, we will see.
9-17-2023 – Our Most Recent Tax-Free Performance – The short term municipal bond market, in general, had a slight negative total return for August 2023; however, for the trailing twelve months the returns improved dramatically, as a very negative month dropped off. Our performance was somewhat different with a positive total return for the month & we continued to beat the averages for the twelve months without having such a poor month drop off, because our total returns have, in general, been much more stable and positive. You can easily see how well we have done in the table below.
Stamper Capital & Investments, Inc.
Separately Managed Accounts (National Tax-Free) vs. Tax-Free Municipal Bond Indices
Annual Total Returns, Period Ended 8-31-2023
| PERIOD | Morningstar Muni Short Category Average | SCI Separately Managed Tax-Fee Municipal Accounts Composite Net of Fees | SCI Separately Managed Accounts Net Pre-Tax Equivalent* | Bloomberg Barclay’s 3 Year Tax-Free Muni Bond Index |
|---|---|---|---|---|
| 1 Year | 1.70% | 2.61% | 4.01% | 1.12% |
| 3 Years | -0.18% | 1.77% | 2.72% | -0.58% |
| 5 Years | 0.91% | 2.07% | 3.18% | 1.01% |
| 10 Years | 1.00% | 1.96% | 3.02% | 1.11% |
| 15 Years | 1.38% | 2.23% | 3.42% | 1.72% |
| Since Inception (1/1/1995) | N/A | 3.65% | 5.61% | N/A |
Note: Indices do not have fees (trading costs, custody fees, management fees, etc.) deducted from their returns. We now have a much more reasonable index to compare to – the Bloomberg Barclay’s 3 Year Tax-Free Municipal Index. We still aim for similar or better returns with less risk – The key with this table is that our longer term pre-tax municipal bond returns are noticeably higher than the bond market index but with What We Think is less risk – we will see when rates start to rise and/or credit quality yield spreads widen.
Please see the Disclaimer and Footnotes at the bottom of the page for more information.
* at 35% Federal tax rate
9-5-2023 – Market Update – Equities – We have new Lower Highs in most equity indices around 9-1-2023. We are looking for new Lower Lows. If we get the new Lower Lows we are expecting, then we expect the Bear Market will be resuming in force, unfortunately. The size (spread out nature) of this top has been remarkable – it has taken a long time and is so far very flat. However, we think it will be accompanied by similarly sized price drops which we believe will could be starting soon. The first step will be new Lower Lows (the initial ones of which are not that far away). Over time, the counter-trend rebounds (corrections) will be smaller and the drops will be larger; thus, the decline will accelerate. Of course, we will see.
8-15-2023 – Our Most Recent Tax-Free Performance – The short end of the Municipal Bond Market had a tough July 2023 – rates up pushing prices down and negative total returns “on average” resulting in a drop in their performance for the current twelve months. We actually, did well, picking up just a bit of performance over the periods and still putting a solid performance over all periods reported. Whether we could do this with “size” is definitely a question.
Stamper Capital & Investments, Inc.
Separately Managed Accounts (National Tax-Free) vs. Tax-Free Municipal Bond Indices
Annual Total Returns, Period Ended 7-31-2023
| PERIOD | Morningstar Muni Short Category Average | SCI Separately Managed Tax-Fee Municipal Accounts Composite Net of Fees | SCI Separately Managed Accounts Net Pre-Tax Equivalent* | Bloomberg Barclay’s 3 Year Tax-Free Muni Bond Index |
|---|---|---|---|---|
| 1 Year | 0.94% | 2.53% | 3.89% | 0.05% |
| 3 Years | -0.12% | 1.77% | 2.73% | -0.50% |
| 5 Years | 0.95% | 2.08% | 3.19% | 1.06% |
| 10 Years | 0.98% | 1.95% | 2.99% | 1.14% |
| 15 Years | 1.44% | 2.24% | 3.44% | 1.80% |
| Since Inception (1/1/1995) | N/A | 3.65% | 5.62% | N/A |
Note: Indices do not have fees (trading costs, custody fees, management fees, etc.) deducted from their returns. We now have a much more reasonable index to compare to – the Bloomberg Barclay’s 3 Year Tax-Free Municipal Index. We still aim for similar or better returns with less risk – The key with this table is that our longer term pre-tax municipal bond returns are noticeably higher than the bond market index but with What We Think is less risk – we will see when rates start to rise and/or credit quality yield spreads widen.
Please see the Disclaimer and Footnotes at the bottom of the page for more information.
* at 35% Federal tax rate
7-26-2023 – Market Update – Equities Still Chopping Sideways to Upward & and an Interesting Divergence – Similar to our previous Update, the markets have continued to Chop (up and down) some sideways and some even down a bit and some upwards quite lot. However, essentially all are below their All-Time Highs. The Dow Jones Industrial Average is up to only 2.38% below its All-Time High; the S&P 500 4.2% below; the NASDAQ Comp 12.2% below; the Russel 2000 18.75% below; the KWB Bank Index (“BKX”) is 39.2% below! and, the Dow Jones U.S. Total Stock Market Index is 6.4% below its All-Time High. More interest sensitive categories we track are also down – “JNK” (Junk bond) is 15.8% below its high and “HYD” (High Yield Municipal Bond) is 19.22% below its. Of course, as we have been documenting, interest rates and financing rates are up considerably over the past couple of years (from their All-Time Lows).
We note, as have others, that the rally over the past year is attributable to chiefly only five or six stocks which are reputably in the AI (Artificial Intelligence) arena. This attributable is why the narrower NASDAQ 100 is only 5.77% below its All-Time High while the broader NASDAQ COMP is 12.2% below its All-Time High. It also accounts for the very strong recent showing in the Dow Industrials and in the S&P 500, as compared to other categories without those AI stocks. Markets that shoot up with very narrow breadth like we are seeing usually are putting in major market tops – this makes sense to us in these markets.
Given the Dow Industrials is now so close to its All-Time High, we would not be surprised for it to put in a new one, while we expect most indicies will not. That would be a major “divergence” which is what is generally seen at major market tops.
Ok, the Interesting Divergence we have been following for a few months now is the differing performance of general real estate ETF’s (“IYR”) and home building ETF’s (“ITB”). IYR is 22.9% below its All-Time High while recently ITB has shot up to a New All-Time High! Wow – what a divergence. We think it will be interesting to see how this resolves.
We believe the markets that haven’t topped recently could top at any time, and soon the markets will see a resumption of their declines, including accelerations downwards in their prices. The large sizes of the divergences, in terms of price and time, to us, are indicative of how large the downturns in price and time will be. Accordingly, we think the upside is minimal and the downside is very large.
7-15-2023 – Our Most Recent Tax-Free Performance – We have continued to outperform. The general short term municipal bond category got a bit of a bounce this month and a negative month dropped off, resulting in a nice twelve month total return. We bounced too but not as much and we had a less poor month drop off but still bested the category quite nicely because we had dramatically less downside volatility last year. Looking forward, we think municipal bond yields in general continue to be far too low for the possible risk of declining tax revenues in the economic downturn that we are forecasting.
Stamper Capital & Investments, Inc.
Separately Managed Accounts (National Tax-Free) vs. Tax-Free Municipal Bond Indices
Annual Total Returns, Period Ended 6-30-2023
| PERIOD | Morningstar Muni Short Category Average | SCI Separately Managed Tax-Fee Municipal Accounts Composite Net of Fees | SCI Separately Managed Accounts Net Pre-Tax Equivalent* | Bloomberg Barclay’s 3 Year Tax-Free Muni Bond Index |
|---|---|---|---|---|
| 1 Year | 1.68% | 2.47% | 3.80% | 0.96% |
| 3 Years | 0.01% | 1.76% | 2.70% | -0.37% |
| 5 Years | 0.95% | 2.08% | 3.19% | 1.08% |
| 10 Years | 0.97% | 1.93% | 2.98% | 1.16% |
| 15 Years | 1.46% | 2.25% | 3.45% | 1.86% |
| Since Inception (1/1/1995) | N/A | 3.65% | 5.62% | N/A |
Note: Indices do not have fees (trading costs, custody fees, management fees, etc.) deducted from their returns. We now have a much more reasonable index to compare to – the Bloomberg Barclay’s 3 Year Tax-Free Municipal Index. We still aim for similar or better returns with less risk – The key with this table is that our longer term pre-tax municipal bond returns are noticeably higher than the bond market index but with What We Think is less risk – we will see when rates start to rise and/or credit quality yield spreads widen.
Please see the Disclaimer and Footnotes at the bottom of the page for more information.
* at 35% Federal tax rate
6-13-2023 – Market Update – A Potential Turn Back down for equities. Since the previous update on 5-14-2023 the markets have continued to Chop (up and down) mostly sideways with an upward tilt except for the NASDAQ Comp and NASDAQ 100 which have been screaming upwards. (Note: the NASDAQ was already above its early February high back in May; we didn’t mention that fact then.) Over the past month, we continued to see divergent behavior in the various indices. With some like the S&P500 rising above their early February 2023 highs and many not even close to them, like the Russell 2000 small cap index (“RUT”). The KWB NASDAQ Bank indes (“BKX”) which we highlighted last update as being in “a clear downtrend,” remains clearly so to us – far below its early February top – basically, the Current Leader.
Important to us is that THE ALL-TIME HIGHS REMAIN CLEARLY INTACT! including the NASDAQ which is still more than 15% below its 11-14-2021 All-Time Top! Also,very important to us is that most of this counter-trend rally is the result of the performances of only fewer than 10 stocks! All of those stocks are in the NASDAQ which is why the NASDAQ looks like it is in a Blow Off Top compared to the rest of the indices. They are also in the S&P500 which is why it is also above its early February 2023 high. In stark contrast, while it may not seem like it, for the vast most part, the rest of the equity market is flat to slightly down over the past several months if you don’t include the performances of those few stocks.
As for the timing of the “Resumption of the Down Durn,” at today’s close the Dow Jones Industrial Average essentially just kissed its early February 2023 high! We think this area would be a perfect place for the fairly large, but exceedingly narrow, counter-trend rally to end. Of course, we will see.
6-12-2023 – Our Most Recent Tax-Free Performance – We have continued to perform very well. The Category Average had a poor month (negative total return) and a good month dropped off the beginning of the current 12 month period. On the other hand, we had a relatively good month (positive total return) and our month that dropped off was not as good. Bottom line, the Category average lost almost 100 basis points in total return for the current twelve months versus the previous, while we lost only two basis points – the results: total return for the Category was 0.86% while we had 2.23%. Yes, the Category Average three year average annual return was reported at exactly 0.00%! while the Short Term Muni Bond Index was a -0.51% (a negative); we were 1.69% so we are pretty happy with that relative outperformance, especially over that long of a time period.
Stamper Capital & Investments, Inc.
Separately Managed Accounts (National Tax-Free) vs. Tax-Free Municipal Bond Indices
Annual Total Returns, Period Ended 5-31-2023
| PERIOD | Morningstar Muni Short Category Average | SCI Separately Managed Tax-Fee Municipal Accounts Composite Net of Fees | SCI Separately Managed Accounts Net Pre-Tax Equivalent* | Bloomberg Barclay’s 3 Year Tax-Free Muni Bond Index |
|---|---|---|---|---|
| 1 Year | 0.86% | 2.23% | 3.43% | 0.24% |
| 3 Years | 0.00% | 1.69% | 2.60% | -0.51% |
| 5 Years | 0.89% | 2.06% | 3.17% | 1.03% |
| 10 Years | 0.83% | 1.91% | 2.94% | 1.02% |
| 15 Years | 1.40% | 2.23% | 3.44% | 1.78% |
| Since Inception (1/1/1995) | N/A | 3.65% | 5.62% | N/A |
Note: Indices do not have fees (trading costs, custody fees, management fees, etc.) deducted from their returns. We now have a much more reasonable index to compare to – the Bloomberg Barclay’s 3 Year Tax-Free Municipal Index. We still aim for similar or better returns with less risk – The key with this table is that our longer term pre-tax municipal bond returns are noticeably higher than the bond market index but with What We Think is less risk – we will see when rates start to rise and/or credit quality yield spreads widen.
Please see the Disclaimer and Footnotes at the bottom of the page for more information.
* at 35% Federal tax rate
5-14-2023 – Market Update – Choppity Chop Chop – We are in essentially the same position as we were for our previous Market Update. Equities continue to chop mostly sideways. Some like the Dow Industrials have chopped up near their early February 2023 highs, but many have chopped downwards and are sitting just above their early March 2023 Lower Low Support; the small caps for example. However, bank stocks and bank stock indices have continued to break down and put in new Lower Lows. An example that we referenced recently (below) is the KWB Nasdaq Bank Index (“BKX”), which includes 24 banking stocks representing the large U.S. national money centers, regional banks and thrift institutions – it is in a clear downtrend. To us the bank stocks are the leader for stocks in this cycle currently. We expect essentially all equities and equity indices to be putting in Lower Lows and to be in very obvious downtrends shortly, unfortunately.
Commodities are in positions similar to our last Update but with Gold performing like the Dow Industrials, rising even through its early February 2023 highs but with oil chopping down towards its early March 2023 lows. We still expect both financial and industrial commodities to drop along with stocks; however, as previously, we are less certain upon whether they will put in the dramatically “Lower Lows” we are expecting for stocks.
Interest Rates – Mostly chopping up and down BUT, the Yield on the One Month U.S. T-Bill just shot up dramatically from 4.33% on 4-20-2023 up to 5.52%! – that is a rise of 119 basis points. The yield curve now has its largest inversion of this cycle, at least from the One Month out to The Five Year which is now at 3.45% (the 30 Year is at a 3.80%). So, our forecast for rising rates resuming seems to be coming true. As we have said before, we believe the Inverted Yield Curve will be resolved mostly by long rates rising rather than by shorter rates falling. Of course, as we have discussed previously, if longer term interest rates go up, prices of bonds and whatever they are financing (which is almost every thing these days) will see related price drops, including stocks, bonds, commodities and Real Estate.
5-14-2023 – Our Most Recent Tax-Free Performance – The Category Average had a big bounce back for the month of April 2023; however, our return is still a good amount higher for the current twelvel months. A more accurate performance guage is probably the longer time periods; needless to say, we are pretty happy with our absolute and relative performances. Interestingly, at this time, we feel general high quality municipal bonds are far too rich versus similar duration U.S. Treasuries. This situation has been going on for about a year but with the recent spike up in short Treasury Yields, we feel the muni market is really due for a correction of sorts. Also, given our forecast for lower quality assets and the economy in general, you can imagine we think that municipal tax revenues could take a big hit. Thus, we are very negative on lower quality and even fairly high quality municipal bonds from a credit quality perspective. Also, we think essentially all municipal bonds are over priced currently and we would not be surprised to see a large sell off across the curve and across all credit qualties. Of course, we will see.
Stamper Capital & Investments, Inc.
Separately Managed Accounts (National Tax-Free) vs. Tax-Free Municipal Bond Indices
Annual Total Returns, Period Ended 4-30-2023
| PERIOD | Morningstar Muni Short Category Average | SCI Separately Managed Tax-Fee Municipal Accounts Composite Net of Fees | SCI Separately Managed Accounts Net Pre-Tax Equivalent* | Bloomberg Barclay’s 3 Year Tax-Free Muni Bond Index |
|---|---|---|---|---|
| 1 Year | 1.85% | 2.21% | 3.40% | N/A% |
| 3 Years | 0.54% | 1.86% | 2.85% | N/A% |
| 5 Years | 1.05% | 2.07% | 3.18% | N/A% |
| 10 Years | 0.82% | 1.90% | 2.92% | N/A% |
| 15 Years | 1.44% | 2.26% | 3.48% | N/A% |
| Since Inception (1/1/1995) | N/A | 3.66% | 5.63% | N/A |
Note: Indices do not have fees (trading costs, custody fees, management fees, etc.) deducted from their returns. We now have a much more reasonable index to compare to – the Bloomberg Barclay’s 3 Year Tax-Free Municipal Index. We still aim for similar or better returns with less risk – The key with this table is that our longer term pre-tax municipal bond returns are noticeably higher than the bond market index but with What We Think is less risk – we will see when rates start to rise and/or credit quality yield spreads widen.
Please see the Disclaimer and Footnotes at the bottom of the page for more information.
* at 35% Federal tax rate
4-16-2023 – Market Update – Our market forecast remains intact. Stock indices have continued to chop mostly sideways with some like the Dow Industrials (and Bitcoin) chopping upwards but with others like the Russell 2000 (small cap stocks) chopping downwards. Importantly, all the previous “lower highs” are still intact! This includes not only the equity indices we follow but the equity-like indices we follow (junk taxable bonds and high yield municipal bonds) and Bitcoin. It has taken longer than we thought it would but we think our forecast is still going to be accurate in terms of prices. And, we believe that the longer it has taken for the next decline to start, the more likely the decline will also be that much longer and larger, unfortunately. Accordingly, we are still forecasting large across-the-board, headline-grabbing equity price declines soon, unfortunately.
Commodities – On the other hand, industrial and financial commodities have put in new “lower highs.” But we still expect commodities to turn down along with equities; however, we are less certain upon whether they will put in the dramatically “lower lows” we are expecting for stocks.
Interest Rates – We expect the rise in interest rates to resume (or has just resumed) with “higher highs” for interest rates. If this forecast is correct; higher interest rates will very likely push down prices of other assets, which goes along with our general asset prices forecast.
Real Estate – Generally sales volumes dry up before price declines. And, that is exactly what we are seeing with real estate. To us it has to do with the “Bond Math” we have explained several times previously. For example, someone with a $1 million house financed at 4% can’t sell it and buy anther $1 million house financed at 6% at the same monthly payment because the interest rate is higher. In order for the monthly payment to be the same, the purhase price has to be lower. The basic formula is: interest rates up = prices down. Now, using “Bond Math” we do not think we have seen nearly a large enough fall in the prices of real estate for the amount of the rise in interest rates & that is why the sales volumes have been drying up. Thus, they can’t buy so they can’t sell. In fact, they aren’t even listing them for sale; for sale listings have dropped. So, sales volumes have dropped as forecast; next, to us should be much larger price drops, unfornately. But, if you can buy cheaper, then you can sell cheaper – the problem is the financing rate – the interst rate – interest raes up = prices down. To us, prices have not dropped nearly enough yet.
4-14-2023 – Our Most Recent Tax-Free Performance – Short term bond markets rebounded in March 2023 after a rough February 2023. The better March 2023 combined with a rough month dropping off of the calculation resulted in much improved one year total returns for the current twelve months. Thus, the category average made up some ground but their improvement from a negative total return to a positive for the year versus our much more stable outperformance highlights our very strong risk-adjusted performane – a larger return with lower volatility – which is what we are striving for – top risk-adjusted performance; and you can see it has paid off for us over the longer periods!
Stamper Capital & Investments, Inc.
Separately Managed Accounts (National Tax-Free) vs. Tax-Free Municipal Bond Indices
Annual Total Returns, Period Ended 3-31-2023
| PERIOD | Morningstar Muni Short Category Average | SCI Separately Managed Tax-Fee Municipal Accounts Composite Net of Fees | SCI Separately Managed Accounts Net Pre-Tax Equivalent* | Bloomberg Barclay’s 3 Year Tax-Free Muni Bond Index |
|---|---|---|---|---|
| 1 Year | 1.07% | 2.25% | 3.46% | 1.52% |
| 3 Years | 0.52% | 1.89% | 2.90% | 0.53% |
| 5 Years | 1.05% | 2.09% | 3.22% | 1.30% |
| 10 Years | 0.87% | 1.91% | 2.94% | 1.14% |
| 15 Years | 1.46% | 2.28% | 3.51% | 1.87% |
| Since Inception (1/1/1995) | N/A | 3.66% | 5.64% | N/A |
Note: Indices do not have fees (trading costs, custody fees, management fees, etc.) deducted from their returns. We now have a much more reasonable index to compare to – the Bloomberg Barclay’s 3 Year Tax-Free Municipal Index. We still aim for similar or better returns with less risk – The key with this table is that our longer term pre-tax municipal bond returns are noticeably higher than the bond market index but with What We Think is less risk – we will see when rates start to rise and/or credit quality yield spreads widen.
Please see the Disclaimer and Footnotes at the bottom of the page for more information.
* at 35% Federal tax rate
3-19-2023 – Our Most Recent Tax-Free Performance – The general, high-quality bond markets had a rather rough month for February 2023. Yes, we did very well with a slight positive total return for the current month which brought our nationally tax-free total return for the one year to +1.69%, which compares very well to the -1.18% (yup that is a negative) for the Category Average for the current year. You can see we also did exceptionally well for the current three years while both the Category Average and the Index put in negative total returns, for the that period. Phew – it has been rough out there in the bond markets over the past couple of years (as we have documented in our Market Commentaries, below) and our knowledge and diligence (and the fact that we are managing a small amount of money compared to the mutual fund we managed for 20 years) has definitely paid off!
Stamper Capital & Investments, Inc.
Separately Managed Accounts (National Tax-Free) vs. Tax-Free Municipal Bond Indices
Annual Total Returns, Period Ended 2-28-2023
| PERIOD | Morningstar Muni Short Category Average | SCI Separately Managed Tax-Fee Municipal Accounts Composite Net of Fees | SCI Separately Managed Accounts Net Pre-Tax Equivalent* | Bloomberg Barclay’s 3 Year Tax-Free Muni Bond Index |
|---|---|---|---|---|
| 1 Year | -1.18% | 1.69% | 2.60% | -1.75% |
| 3 Years | -0.35% | 1.78% | 2.74% | -0.43% |
| 5 Years | 0.83% | 2.04% | 3.14% | 0.97% |
| 10 Years | 0.75% | 1.88% | 2.89% | 0.99% |
| 15 Years | 1.46% | 2.24% | 3.44% | 1.66% |
| Since Inception (1/1/1995) | N/A | 3.66% | 5.63% | N/A |
Note: Indices do not have fees (trading costs, custody fees, management fees, etc.) deducted from their returns. We now have a much more reasonable index to compare to – the Bloomberg Barclay’s 3 Year Tax-Free Municipal Index. We still aim for similar or better returns with less risk – The key with this table is that our longer term pre-tax municipal bond returns are noticeably higher than the bond market index but with What We Think is less risk – we will see when rates start to rise and/or credit quality yield spreads widen.
Please see the Disclaimer and Footnotes at the bottom of the page for more information.
* at 35% Federal tax rate
3-16-2023 Market Comment – More on Banking and Silicon Valley Bank (Parent “SIVB”) implosion’s effect on the economy. Here is a comment posted today on AOL (Yahoo News) from the President of a bank that we think is very telling:
“When you have banks like us pulling back from lending because we’re concerned about our ability to raise enough liquidity to weather whatever storm may come, even though we’re sitting in a very good spot today with almost 50% liquidity. That’s a crisis, in my opinion,” Martin said.
His response to the liquidity problems at Silicon Valley bank and Signature Bank (“SBNY”), etc. is likely typical and we think appropriate – in order to raise liquidity for potential cash withdrawls by depositors, he is going to make fewer loans and raise cash levels. To us, this action is “Contractionary;” in fact, the already-here liquity issues indicate the economy is already contracting (which we already knew, see below). Because most banks are going to take this action, the result will be less lending which will result in an additional “slow down” in the economy, which, with two negative quarters of GDP, was already slowing down. Also, because the banks are going to compete less to make loans (make fewer loans), lenders will likely have to pay higher interest rates. So, the liquidity issue will likely result in interest rates going up more. In addition, the Federal bailout of depositors over the $250,000 insurance limit is to be funded by increased insurance fees paid for by bank depositors; thus, pushing up those costs. Again, we think that will be “Contractionary,” unfortunately.
Accordingly, we still believe what we said on 2-19-2023 (below): “Importantly, we are expecting very large price drops out of the current choppy corrective sideways moves. We think these moves (if they happen) will be large enough to capture the general public’s attention.” We believe, as we indicated in our 3-13-2023 Market Comment, that as more market indices break below their December 2022 lows, we will see an acceleration in price declines resulting in price drops that are quite notable.
We note that West Texas Intermediate crude OIL just dropped in price below its December 2022 price low on 3-14-2023; thus, re-inforcing our forecasts. Of course, this is an Industrial Commodity. Prices of Financial Commodities like Gold have been rising recently; however, we expect they will resume their fall, possibly in response to the contracting economy and also rising interest rates (as most of their ownership is financed).
Interest Rates – Interest rates on the highest quality longer bonds have dropped along with the current events; however, we expect they will start rising again soon. Interest rates of lower quality bonds should rise even more (and faster) as the economy continues to weaken and lenders (and junk bond owners) become more concerned about being paid back and want to be compensated more (with higher interest rates); thus, we expect “credit quality yield spreads” will continue to widen. We are watching prices of several Junk taxable Bond ETF’s and a couple High Yield Tax-Free Municipal Bond ETF’s – they have all been declining in price (interest rates up) and are hovering above their December 2022 lows. Once, these lows are breached, we would not be surprised to see their prices drop precipitously.
Of course, this is our Opinion and “we will see.”
3-13-2023 – Market Comment – Did The Next Drop in Equity Prices Start? – Yes, we think so. We have been patiently waiting for the next drop to start, and it most likely has. We have been watching the market indices relative to their December 2022 bottoms (looking for new “lower lows”). Most equity indices have distinct price bottoms in December 2022; some less distictive than others, but, we have been waiting for those lows to be broken; thus, putting in “lower lows” which to us, confirms the downtrends have resumed. Right now only a few have put in the “lower lows” we have been looking for – for “confirmation” of the resumption of the downturns but all of them have been heading downwards in price for some time now.
Importantly, the Dow Jones Industrial Average passed below its December 2022 bottom slightly on 2-28-2023, bounced back above it and then dropped substantially below it on 3-10-2023, the same day Silicon Valley Bank (“SIVB”-NASDAQ) was taken over by the Feds. Importantly, on Monday 3-13-2023 the Dow Industrials continued downward by another 90 or so points.
The KWB Nasdaq Bank Index (“BKX”) includes 24 banking stocks representing the large U.S. national money centers, regional banks and thrift institutions. The KWB Index also has a December low on 12-19-2022 (same day as the Dow Industrials and several other equity indices). It passed below its December 2022 low on 3-9-2023 (so a bit behind the Dow Industrials); and more so on 3-10-2023, the day Silicon Valley Bank was taken over. Today (3-13-2023, the next trading day), the KWB indice fell another 11.66%!; it now is pretty far below its December 2022 low – definitely a “lower low” and, to us, this is confirmtion that it has resumed its downtrend. Of course, after such a drop and so much publicity a choppy partial rebound is likely, but to us the trend in price is down.
Most other equity indices we watch have been heading down to their December 2020 lows but are not below them (yet). The most notable is that of the Russell 2000 which probably had risen the furthest above its December 2022 price low (the Dow Industrials probably had the smallest rise); The Russell 2000’s price has been heading down hard over the past week and is very close to a “lower low.” The couple of Junk Bond indices we follow have dropped down and have been hovering on their December 2022 lows for a while as have the few High Yield Municipal Bond Indices we follow. We really wanted breaks of the December 2022 price lows (putting in “lower lows”) by more indices before reporting it but then the Banks got hammered (we note: a few days after the Dow Industrials has already broken its December low (per above) so we decided to point it out now.
Will the Silicon Valley Bank depositor bailouts for those over the $250,000 insurance limit stop the price declines we are forecasting? No, we do not think so. In fact, the bank’s problem is an indication that goes along with our forecast. As we have pointed out so many times previously, when interest rates rise, very often “financial things break;” that is probably what is happening now.
2-19-2023 – Market Comment – Chopity Chopity Chopity Chop – Prices of most asset cagegories have continued to Chop – short up and down movements – with little to no upward progress since late November 2022. Importantly, the way we see it, they are all essentially still in downtrends – in an sideways/upward correction, still heading downwards from their All-Time Tops. Financial commodities like Gold have rallied more as has BitCoin but we think they are still ultimately in larger downtrends. It seems most markets are moving together similarly to during the Housing Bubble top (2006-2007) and subsequent Financial Crash (down in to 2009-2012). Those moves then were opposite of the U.S. Dollar and we would not be surprised that the financial markets are now in a similar situation. Time will tell. Importantly, we are expecting very large price drops out of the current choppy corrective sideways moves. We think these moves (if they happen) will be large enough to capture the general public’s attention.
2-16-2023 – Our Most Recent Tax-Free Performance – The current twelve month performance of short term bond market, in general, bounced back significantly partly due to a solid bounce in prices (drop in yield) in January 2023 but mostly because of a drop off of the January 2022 performance which was very negative for normal bonds. You can see we are still doing very well and, we have done it with much less volatility, which is often used as a measure of risk; thus, we feel we’ve hit our target of superior risk-adjusted performance (as well as superior absolute performance).
Stamper Capital & Investments, Inc.
Separately Managed Accounts (National Tax-Free) vs. Tax-Free Municipal Bond Indices
Annual Total Returns, Period Ended 1-31-2023
| PERIOD | Morningstar Muni Short Category Average | SCI Separately Managed Tax-Fee Municipal Accounts Composite Net of Fees | SCI Separately Managed Accounts Net Pre-Tax Equivalent* | Bloomberg Barclay’s 3 Year Tax-Free Muni Bond Index |
|---|---|---|---|---|
| 1 Year | -0.45% | 1.61% | 2.48% | -0.42% |
| 3 Years | 0.07% | 1.80% | 2.77% | 0.19% |
| 5 Years | 1.02% | 2.06% | 3.18% | 1.30% |
| 10 Years | 0.68% | 1.89% | 2.90% | 1.18% |
| 15 Years | 1.42% | 2.27% | 3.49% | 1.87% |
| Since Inception (1/1/1995) | N/A | 3.67% | 5.64% | N/A |
Note: Indices do not have fees (trading costs, custody fees, management fees, etc.) deducted from their returns. We now have a much more reasonable index to compare to – the Bloomberg Barclay’s 3 Year Tax-Free Municipal Index. We still aim for similar or better returns with less risk – The key with this table is that our longer term pre-tax municipal bond returns are noticeably higher than the bond market index but with What We Think is less risk – we will see when rates start to rise and/or credit quality yield spreads widen.
Please see the Disclaimer and Footnotes at the bottom of the page for more information.
* at 35% Federal tax rate
1-17-2023 – Our Most Recent Tax-Free Performance – You can see from the following chart that we did exceedingly well in an exceedingly tough year for the bond market. Essentially, all bond categories lost money in 2023, even the short term categories – even the short term Tax-Free Municipal Bond categories; but we had a +1.36% nationally tax-free return! It was exceedingly tough to achieve that kind of performance in that market. With perfect hindsight, we could have been even more disciplined but it was very difficult to find the bonds we wanted. At times we ended up with fairly high percentages of cash – we just could not find what we wanted and, at those times, the market ended up trading off, which worked to our advantage. In perfect hindsight, we could have done better without certain purchases at the recent market tops; still, given how everyone else did, we’ll take our performance! And, you can see, it bolstered our long term performance too!
Stamper Capital & Investments, Inc.
Separately Managed Accounts (National Tax-Free) vs. Tax-Free Municipal Bond Indices
Annual Total Returns, Period Ended 12-31-2022
| PERIOD | Morningstar Muni Short Category Average | SCI Separately Managed Tax-Fee Municipal Accounts Composite Net of Fees | SCI Separately Managed Accounts Net Pre-Tax Equivalent* | Bloomberg Barclay’s 3 Year Tax-Free Muni Bond Index |
|---|---|---|---|---|
| 1 Year | -2.68% | 1.36% | 2.09% | -3.39% |
| 3 Years | -0.10% | 1.71% | 2.63% | -0.04% |
| 5 Years | 0.78% | 2.03% | 3.13% | 1.05% |
| 10 Years | 0.79% | 1.87% | 2.87% | 1.06% |
| 15 Years | 1.43% | 2.25% | 3.46% | 1.92% |
| Since Inception (1/1/1995) | N/A | 3.67% | 5.64% | N/A |
Note: Indices do not have fees (trading costs, custody fees, management fees, etc.) deducted from their returns. We now have a much more reasonable index to compare to – the Bloomberg Barclay’s 3 Year Tax-Free Municipal Index. We still aim for similar or better returns with less risk – The key with this table is that our longer term pre-tax municipal bond returns are noticeably higher than the bond market index but with What We Think is less risk – we will see when rates start to rise and/or credit quality yield spreads widen.
Please see the Disclaimer and Footnotes at the bottom of the page for more information.
* at 35% Federal tax rate
12-19-2022 Market Comment – Equities & Commodities & Cyber”Currencies”– We have just seen “Lower Highs” and “Lower Lows” in essentially all major equity indices including real estate (EFT “IYR”) on a daily basis. Also Junk taxable Bonds (“JNK”) and High Yield tax-free Municipal Bonds (EFT “HYD”) on an hourly basis. And, commodities West Texas Intermediate Crude Oil and Silver but Gold with only a “Lower High” so far. Bitcoin (BTCUSD) made it all the way up to over 21,000 but, fell sharply back down to below 16,000 before rebounding a bit to under 17,000 currently. We have been looking for the next large downtrends in prices of risky assets and it seem they are here (even for low risk assets). We wouldn’t be surprised to see quick drops back down to the Lows of late September/early October 2022; then maybe a choppy rebound and then off to the next set of drops. It could be a rise in rates (see next Section) could be the trigger as most assets are highly leveraged with debt financing.
Interest Rates – Interest rates at the long end of the curve have risen enough (to us) that the trend in yields at the long end of the curve is upwards again. We would not be surprised for the short end of the Yield Curve to follow along with the long end’s rate rise. The Yield Curve is still well inverted but we are looking for that inversion to end from longer rates going up more rather than from short rates dropping. Of course, we will see.
12-18-2022 – Our Most Recent Tax-Free Performance – We’ve continued to perform well. The averages bounced back a bit so they are quite a bit less negative for the current twelve months. We also bounced back a bit but were already positive for the period. Now that interest rates at the short end of the Yield Curve are pretty high, any increases in yield (decreases in bond prices) should be cushioned more by the high current income than when yields were starting from such low levels. This is also true for longer maturities except the the Yield Curve is inverted; we believe the Yield Curve Inversion will turn back to “normal” (short rates lower than longer rates) mostly by yields of longer bonds rising than yields of shorter bonds dropping. Of course, we will see.
Stamper Capital & Investments, Inc.
Separately Managed Accounts (National Tax-Free) vs. Tax-Free Municipal Bond Indices
Annual Total Returns, Period Ended 11-30-2022
| PERIOD | Morningstar Muni Short Category Average | SCI Separately Managed Tax-Fee Municipal Accounts Composite Net of Fees | SCI Separately Managed Accounts Net Pre-Tax Equivalent* | Bloomberg Barclay’s 3 Year Tax-Free Muni Bond Index |
|---|---|---|---|---|
| 1 Year | -2.89% | 1.42% | 2.19% | -3.52% |
| 3 Years | -0.11% | 1.74% | 2.68% | -0.03% |
| 5 Years | 0.78% | 2.05% | 3.15% | 1.06% |
| 10 Years | 0.72% | 1.87% | 2.87% | 1.03% |
| 15 Years | 1.45% | 2.27% | 3.50% | 1.95% |
| Since Inception (1/1/1995) | N/A | 3.67% | 5.65% | N/A |
Note: Indices do not have fees (trading costs, custody fees, management fees, etc.) deducted from their returns. We now have a much more reasonable index to compare to – the Bloomberg Barclay’s 3 Year Tax-Free Municipal Index. We still aim for similar or better returns with less risk – The key with this table is that our longer term pre-tax municipal bond returns are noticeably higher than the bond market index but with What We Think is less risk – we will see when rates start to rise and/or credit quality yield spreads widen.
Please see the Disclaimer and Footnotes at the bottom of the page for more information.
* at 35% Federal tax rate
11-28-2022 Market Comment – Equities –Well, we got the Bitcoin drop (see previous Market Comment) but equities have not yet joined in with gusto; however, (see Data below) it looks to us like some of the equity rebounds have ended with various retracement percentage rallies of previous drops and new tops of varying dates with the Dow dropping the least, rebounding the most, and putting in the most recent peak (with other equity indices putting in recent peaks days to even weeks previous). All other equity indices we looked at follow this pattern (see below). Most people watch The Dow Industrials but there is a lot more going on. The Dow Industrials have held up far better than all the other equity indices we have looked at but give a less accurate view of the markets at this juncture – to us, things are weaker than the Dow Industrials look.
Here is the data on the most recent cycle: The Dow Jones Industrials dropped about 16% from its 8-16-2022 peak down to its 9-30-2022 bottom; since then it has rebounded retracing just over 100% of that drop to Friday 11-25-2022, and dropped a bit below that 8-16-2022 peak by today’s close. The Dow Jones Transports dropped about 21% from its 8-16-2022 peak down to its 9-26-202 bottom; since then it retraced about 2/3rds of that drop to a top on 11-15-2022 from which it has dropped by a bit over 3%. The Wilshire 5000 dropped by about 17% from its 8-16-2022 peak down to its 9-26-202 bottom; since then it retraced about half of that drop to a top on 11-25-2022 from which it has dropped by a bit over 1.5%. The NASDAQ dropped about 21% from its 8-15-2022 peak down to its 10-14-202 bottom; since then it retraced about 25% of that drop to a top on 11-15-2022 from which it has dropped by a bit about 2.7%. The same pattern exists for the Russel 2000 (small caps) and Junk Bonds, High Yield Municipal bonds and Real Estate (ETF “IYR”) that we have been following – with retracements of about 50% or less of their corresponding previous drops. We do believe these will all be “in sync” during the next large asset price drops, which we think are due at any time.
Back to Bitcoin – Since its last big drop (see previous Market Update), Bitcoin (“BTCUSD”) has been moving along a new shelf around 16,250. We expect it to break down notably from that shelf.
Oil – From its 5-1-2022 top, Oil (WTI) has dropped by 32.5% to its current low today (11-28-2022) at $77.21 – Its previous low was at $20.48 on 1-1-2020. For now, we expect oil’s price to drop along with equities and other asset prices, probably at least down to around $50.
11-18-2022 Our Most Recent Tax-Free Performance – We’ve continued to keep our large lead. Again, yes that is a -4.14% for the current twelve months by the Category Average, -5.35% for the corresponding Muni Bond Index (compared to our +1.20%). Quite amazing but yields of “normal bonds” went up a lot from very low levels as we forecasted and documented in these pages, causing the large negative total returns for typical bonds. And those are “Averages” – the mutual funds in the catagory that had the longest durations (a measure of interest rate risk, similar to maturity length) were down much more – I see one that was down 7.41% (-7.41%) for the current twelve months. “Live by the Sword, Die by the Sword” – those taking them most interest rate risk did the best when rates were dropping and now gave it all back during the rate rise. Our very short durations, including very large coupons and also being heavily in cash right at the worst part of the market (i.e. lowest yields) because we just couldn’t find anything we liked at those levels (as we documented below), helped us put in a very good relative performance. Basically, our method of “Focusing on the Upside Potential and Downside Protection & Current Yield” methodology worked rather well. (To be fair, it is highly unlikely we could have put forth our incredible relative performance managing the billion dollar, plus mutual fund I managed for 20 years ending July 2010 – it was very difficult for us over the past few years, to find bonds we liked even for our private accounts.)
Looking forward, recently we have had much better success finding & purchaing bonds that we like (even if we think they are somewhat over priced). The market sell off has created much better opportunities than we have seen for years. We expect continued dissarray in the bond markets to present opportunites for our clients.
Stamper Capital & Investments, Inc.
Separately Managed Accounts (National Tax-Free) vs. Tax-Free Municipal Bond Indices
Annual Total Returns, Period Ended 10-31-2022
| PERIOD | Morningstar Muni Short Category Average | SCI Separately Managed Tax-Fee Municipal Accounts Composite Net of Fees | SCI Separately Managed Accounts Net Pre-Tax Equivalent* | Bloomberg Barclay’s 3 Year Tax-Free Muni Bond Index |
|---|---|---|---|---|
| 1 Year | -4.14% | 1.20% | 1.85% | -5.35% |
| 3 Years | -0.57% | 1.71% | 2.63% | -0.60% |
| 5 Years | 0.37% | 1.99% | 3.07% | 0.48% |
| 10 Years | 0.60% | 1.84% | 2.84% | 0.85% |
| 15 Years | 1.40% | 2.27% | 3.50% | 1.87% |
| Since Inception (1/1/1995) | N/A | 3.67% | 5.65% | N/A |
Note: Indices do not have fees (trading costs, custody fees, management fees, etc.) deducted from their returns. We now have a much more reasonable index to compare to – the Bloomberg Barclay’s 3 Year Tax-Free Municipal Index. We still aim for similar or better returns with less risk – The key with this table is that our longer term pre-tax municipal bond returns are noticeably higher than the bond market index but with What We Think is less risk – we will see when rates start to rise and/or credit quality yield spreads widen.
Please see the Disclaimer and Footnotes at the bottom of the page for more information.
* at 35% Federal tax rate
11-09-2022 Market Update – We have been looking for the current choppy counter-trend partial-retracement rebounds in prices of stocks, “cryptocurrencies,” commodities and other assets to “top out” and for drops to take out previous All-Time Lows since their All-time Highs (largely in late 2021 or early 2022, see previous updates). Panic – we were and are still looking for some panic by the holders of at least some of those assets. Last time, we said
We note that, in the current downtrend, we have yet to see any panic in those bond markets nor the stock market yet but, if our forecast is correct, we expect we will see that kind of emotion and accompanying price action. Of course, we will see.
Well, today Bitcoin (BTCUSD), which had been chopping sideways from months, finally dropped below its 6-18-2022 low – it had lagged almost all other indices in doing so but now appears to us to be The Leader in the next part of the down draft. Over the last week it fell, to today, by about 27% to be about 11% below its June low. That is the largest move on the chart since June 2022 and most of the drop was today. It is now at its Lowest Low since its All-Time High. The Fundamental news was that world’s second-largest crypto exchange, FTX, was “suddenly” in trouble and then filed for bankruptcy. Apparently, investors in it will or have lost several billion dollars. We are not experts in this credit but, because of its size and the asset category, we would expect large ripples could rock other areas (prices) of “finance.”
Also, we think it is important When the various asset classes have had their most recent peaks – are they turning downward? BTCUSD’s most recent peak was back on 8-13-2022; thus, yes it has turned downward. The Dow Jones Industrials’ most recent peak was yesterday on 11-8-2022 – so it really hasn’t turned down much. We also note that the Dow Industrials have rebounded the most from their recent low (9-30-2022) of most asset classes. Also having its recent peak on 11-08-2022 are the Dow Transports. Other assets that have earlier peaks and that we think have already turned downward are the Russel 2000 (Small Caps) on 11-1-2022; the S&P 500, Wilshire 5000, Dow Utilities, Real Estate (“IYR” ETF proxy), and Junk Taxable Bonds (ETF “JNK” proxy) on 10-28-2022; the NASDAQ Comp and the NDQ (100) on 10-25-2022. Note: NASDAQ is on the verge of putting in a new lower low – so in that way it is one of the leaders of this down draft. Also, we note that most of those indices put in current lower lows on around 10-10-2022 and then had rebounds to those peaks (above); however, the high yield municipal bond tax-free funds (“HYD,” “SHYTX,” “HYMB”) we are tracking already put in lower lows and seem to be ahead in the “stair stepping” downward; however, they do have the aspect of declining credit quality and the huge rise in interest rates (this year) since they are bond funds.
The bottom line, for us, is that Bitcoin has just met our forecast by putting in new Lower Lows in a pretty precipitous drop and we expect the rest of the equity type assets will join very shortly. As outlined previously, “the drops should be striking enough to be reported in the regular media.” As for high quality bonds, their prices have dropped a huge amount (interest rates up) and we expect a “breather” rally shortly (interest rates down a bit) before the trend in falling prices/rising interest rates resumes (per our previous Update Comments).
10-27-2022 Market Update – The markets have continued to chop upward longer in pretty typical bear market rallies with some retracing more of the previous drops than others. The biggest rebounder has been the Dow Jones Industrials followed by the Russell 2000, then the S&P 5000 with the higher beta NASDAQ bringing up the rear, which could be telling. Also, the more interest-rate sensitive equity-like indices, which often lead stocks, have rebounded even less – the Dow Utilities and Junk Taxable Bonds (ETF “JNK”) – and High Yield Municipal Bonds (ETFs “HYD” “SHYTX” and “HYMB”) have continued downward! which also might be telling. Real Estate ETF “IYR” has chopped mostly sideways with somewhat of a rebound but more than Bitcoin. The amount of time and rebound of prices is more than adequate for a typical bear market rally, so we expect a resumption of the downtrend we have been detailing at any time. If/when so, prices should very quickly take out recent prior lows into All-Time Lows since the All-Time Highs in late 2021 and/or 2022 (see previous posts for details) and then plummet further – the drops should be striking enough to be reported in the regular media.
U.S Treasury Interest Rates have continued to rise which will put more pressure of prices of most assets as most are fairly heavily financed. The highest part of the curve right now is the 6 Month U.S. T-Bill at 4.52% – One year ago it was at almost 0.0% – so that is a huge increase that will ultimately be reflected in lower asset prices. For now, it looks like the rise in interest rates will likely take a “breather” (break); at least, yields of U.S. Treasuries, the safest. It may be that as stocks go down sharply, money flows into the Treasury Market. In that case, money will not likely flow into Junk Taxable bonds nor High Yield Munis, in fact, all bonds except U.S. Treasuries could experience notable sell offs to raise money for margin calls and due to credit quality concerns. That is the scenario that we saw in 2008 when we were managing the Billion Dollar Evergreen Strategic Municipal Bond Fund (“VMPYX” “VMPAX”) through The Financial Crash. We note that, in the current downtrend, we have yet to see any panic in those bond markets nor the stock market yet but, if our forecast is correct, we expect we will see that kind of emotion and accompanying price action. Of course, we will see.
10-13-2022 Our Most Recent Tax-Free Performance – You can see from the table, below, that we have continued to outperform the Short Muni Mutual Fund average – now, incredibly by over 500 basis points for the current twelve months ending 9-30-2022; and, by lesser (but still large) annual percentages over all other periods reported. Importantly, these performances at this point in time (just after a huge drop in bond prices, in general) very well illustrate how superior risk-adjusted performance adds value. At market tops it is much more difficult to understand and explain this concept. But right now, you can see that, for the current one year we had a +1.01% total return and the category average was -4.15%. The key is that not only did we outperform but we did it with less volatility and less downside risk. At market tops the benefit is not nearly as obvious because some will say, “well, we would have taken more risk to get a higher return.” It is easy to say that “after the fact” when “after the fact” is after a rally rather than after a price collapse.
Stamper Capital & Investments, Inc.
Separately Managed Accounts (National Tax-Free) vs. Tax-Free Municipal Bond Indices
Annual Total Returns, Period Ended 9-30-2022
| PERIOD | Morningstar Muni Short Category Average | SCI Separately Managed Tax-Fee Municipal Accounts Composite Net of Fees | SCI Separately Managed Accounts Net Pre-Tax Equivalent* | Bloomberg Barclay’s 3 Year Tax-Free Muni Bond Index |
|---|---|---|---|---|
| 1 Year | -4.15% | 1.01% | 1.55% | -5.46% |
| 3 Years | -0.48% | 1.72% | 2.64% | -0.44% |
| 5 Years | 0.37% | 1.97% | 3.04% | 0.48% |
| 10 Years | 0.62% | 1.84% | 2.83% | 0.85% |
| 15 Years | 1.42% | 2.28% | 3.51% | 1.90% |
| Since Inception (1/1/1995) | N/A | 3.67% | 5.65% | N/A |
Note: Indices do not have fees (trading costs, custody fees, management fees, etc.) deducted from their returns. We now have a much more reasonable index to compare to – the Bloomberg Barclay’s 3 Year Tax-Free Municipal Index. We still aim for similar or better returns with less risk – The key with this table is that our longer term pre-tax municipal bond returns are noticeably higher than the bond market index but with What We Think is less risk – we will see when rates start to rise and/or credit quality yield spreads widen.
Please see the Disclaimer and Footnotes at the bottom of the page for more information.
* at 35% Federal tax rate
10-10-2022 – Extra – Here is a nice table (compiled by someone else) that we have named, “Drops from their Tops,” that gives more information to what we have been forecasting and documenting:
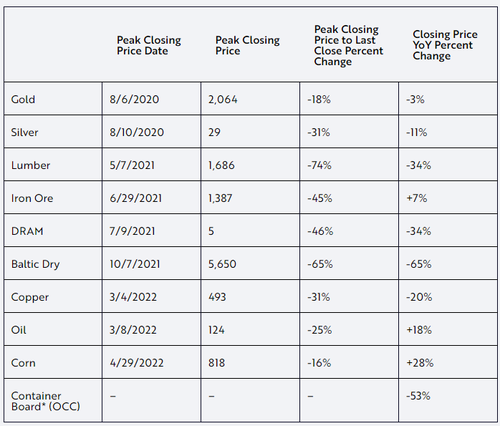
It shows their peaks and percentage drops until about now (they didn’t put the ending date).
10-9-2022 – Market Update – Most equity indices took out (went below) their June 2022 lows as forecast; thus, putting in their Lowest Lows since their All-Time Highs (typically in late 2021 or the first week of 2022). We also said, that those that had already fallen below their June 2022 lows would likely fall further as the laggers reached their June 2022 lows and this happened too. For example, the Dow Industrials fell, from then, by another almost 3% below its June 2022 low. Maybe importantly, this drop brought the Dow Industrials “Drop from The Top” (its All-Time-High, daily close, on 1-4-2022) to 21.9%; thus, putting it in a Bear Market (a 20% decline or more is generally defined as being in Bear Market). That was a low and we had a pretty big bounce the following couple of days before a similarly large drop. Most Equity Indices performed similarly. One that “outperformed” to the downside is the Dow Jones Transports; down almost 30% from its All-Time High in late 2021.
One that put in its All-Time High late but is now “a leader” is the Dow Jones Utility Index, which is more sensitive to interest rates than most equities. It is down “only” 19.4% from its All-Time high on 4-20-2022 (closing basis) but, it took out its recent low so it is at its Lowest Low since its All-Time high; in that way The Utility stocks are a leader of this cycle. Note, with respect to the Dow Theory, all three – Industrials, Transports and Utilities – are in alignment in the downward direction.
Another “Leader” of this cycle is another category that is more sensitive to interest rates, somewhat similar to Utilities but has fallen more. The iShares U.S. Real Estate ETF (“IYR”) also took out its June 2022 lows and also is below its recent low of 9-30-2022 and is now down 32% from its All-Time top on 12-30-2021 (closing prices). Importantly, the price drop in this category in the equity market has yet to be recognized in the residential real estate market.
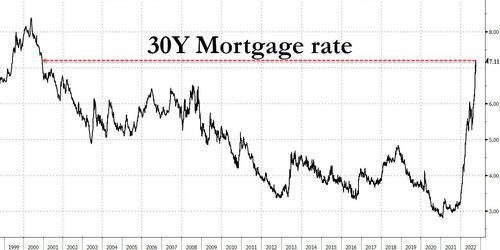 The chart above shows the U.S. 30 year mortgage rate has risen substantially from under 3% in early 2021 to over 7% currently with a “near-vertical” rise. The mathematics is that, in order to have the same monthly payment financed at 7% versus 3%, the amount one could borrow is substantially lower. That drop in borrowing has yet to be reflected in prices of residential real estate.
Also note in the Chart that the U.S. 30 year mortgage rate started down at a top in early 2000, right when we had the Technology Stock Top; then it dropped right along with the “Tech Wreck” into the 2003/2004 low. Next, it rose with the Housing Bubble (and stock market) before dropping right along with the “Financial Crash” (in most asset prices except the U.S. Dollar) down into lows of 2009 to 2012 (depending upon the asset class). At that point, the fairly high positive correlation ended. And, starting from its All-Time low in early 2021, we think it has a highly negative correlation with asset prices; thus, the spectacularly steep (“near-vertical”) rise in the U.S. 30 year mortgage rate is slightly leading the drops in prices of stocks and real estate, etc.
Gold and Silver have been dropping in price but not as much as the stock market. The situation is similar with Precious Metals Mining Stocks (“GDX” ETF). We are not experts in these Companies; however, we have been reading that the price increases in fuels that the mining companies use could overwhelm a rising precious metals market and combine for worse effects in a declining precious metals market. The cost of financing – both business and inventories by companies and individual holders/owners is another important issue – most is financed so the rising cost of interest could, or could be, take/taking a toll. In this cycle neither precious metals nor mining stocks worked as an inflation hedge (some day they probably will again). If interest rates continue upwards as we are forecasting, and we are in a deflation, as we are forecasting, precious metals and mining could continue to be under pressure. If, in addition to that, we have prices of fuel rising (even while in a deflation) because of supply constrictions, precious metal assets could take a big price tumble. Thus, we think this area is also very speculative.
Also, we note that Bitcoin‘s price has continued to chop sideways in a fairly narrow channel (if you look at a longer term chart). We still believe its price will plunge downwards out of this choppy sideways channel.
Looking forward, we expect further price drops in most asset classes. The next target is the “Pre-Covid Tops” in February 2020 and after that the “Covid Lows” a month later in March 2020 (remember that drop!). With respect to these targets, we are in a similar situation to what we just went through. For example, the Dow Industrial Average is already (just barely) below its “Pre-Covid Top.” However, the S&P 500 is over 7% above its “Pre-Covid Top.” In this area the Dow Utility Average is a Leader – down almost 10% below its “Pre-Covid Top.” Another one right at its “Pre-Covid Top is the Russel 2000 Small Cap Index. Interestingly, Junk Bonds (“JNK” ETF) never really got above its “Pre-Covid Top” – it got up to it but essentially not above it and is now only 2.8% above its “Covid Low” – this is only using prices and not including the interest/dividends that it receives and pays; however, the category has proven itself over many cycles to be a leader of equity prices and likely so this time too. “GDX” (mining stocks) is below its “Pre-Covid High” but over 28% above its “Covid Low.” Bitcoin has a long way to go down to its “Pre-Covid High” and its “Covid Low” -it is still 263% above its “Covid Low!” You can see there is a lot of variability in where the prices of various asset classes are relative to these two targets; however, in downturns there is usually a convergence in prices and returns and we would expect this to be the case if our forecast proves to be correct. We think the next downlegs will be significant, unfortunately.
9-25-2022 – Market Update – On our last update on 9-5-2022 we said,
…we are looking for the downtrends in the prices of most assets to accelerate soon; we expect prices will drop quickly to their various previous levels of around June of earlier this year, and then likely take another “breather” before resuming their downtrends once again. However, given how precarious everything is, we expect surprises to be to the downside and they could be large.
The next day the markets drifted a bit lower but over the next few days the Dow Industrials rose sharply by almost 4%; however, in a HUGE one day drop, the markets gave it all back. Continuing downwards, from that top through last Friday the Dow Industrials dropped a total of 8.16% and took out (dropped below) its June low as we forecasted. Interestingly, with similar market actions, several indices took out their June lows; however, some have not. For example the S&P 500 is still 0.7% above its corresponding June 2022 low. Some indices have broken down through further than others. The Dow Industrials is 1% below its June 2022 low but, the Dow Transports dropped to 6% below its June 2022 low. We believe all major equity indices that haven’t, will soon take out their June 2022 lows. If that happens, those that are already below them will most likely drop even more; thus, we are expecting the “surprises to be to the downside” as we alluded to previously.
Other types of indices also broke down through their June 2022 lows – Junk Bonds (ETF “JNK) fell to 1.7% below its June 2022 low. High Yield Municipal Bonds (ETF “HYD”) fell to 1% below. Bitcoin (“BTCUSD”) followed a similar, if not more volatile pattern. It went down the first day, then shot up by 13% over the next three days, and then dropped to 4.3% below where it was on 9-5-2022; however, it is still above its June low by 6.5% – still, we are expecting a large drop that will take it below its June 2022 lows. If you look at the long term chart, even though these percentage moves are rather large, overall, the move since June 2022 is just a long, choppy sideways move (which we think it will break down out of in notable fashion along with the other markets).
Real Estate (EFT “IYR”) also broke down below its June 2022 low by 1.3%
Commodities performed somewhat similarly. The Commodities Research Board (CRB) fell to 0.85% below its JULY 2022 low. Gold has fallen to 2.9% below its July 2022 low. Oil did not have a June nor July 2022 low but has fallen, in a persistent choppy fashion, almost 35% from its June 2022 high.
The point we want to make here is that most of these indices and categories have put in new lows or are close to doing so. The only “investment” that is rising is the U.S. Dollar, which has been continuing to breakout to higher highs. This situation is very similar to the Financial Crash (2007 – 2010) down from the Housing Bubble Top (2005-2007) where the U.S. Dollar went up and essentially everything else went down.
Bonds/Interest Rates – The other thing that has gone up to new highs is Interest Rates. (Remember interest rates up = bond prices down.) We have had all kinds of activity in the U.S. Treasury Market. While the 30 Year and the 10 Year Treasury yields have broken out to significant new highs (3.61% and 3.69%, respectively), their yields are still lower than those of the short end of the Treasury Interest Rate Yield Curve, which have shot up even more! It is quite amazing (and reflects inflation expectations) that the highest yield yielding Treasury is the Three Year Note at 4.32%! Also above 4% are the Two Year Note and the One Year T-Bill. The Six Month T-Bill is at 3.91%, so also above the yields of the 10 year and the 30 year U.S. Treasury yields!
Looking forward from here, we expect the major trends in most asset prices to be downward. However, given how persistent some of the drops have been (Treasury Bond and Note prices) we wouldn’t be surprised to see some categories break from the rest. However, while we expect that while that may be true, in hindsight, if you look at the long term price graphs, they will still trend together as bonds and stocks have in most longer term cycles.
And, as previously, “we expect surprises to be to the downside and they could be large.”
Also note, that we expect overall inflation to subside and turn into deflation as declining asset prices and rising interest rates result in defaulting companies and securities, pushing up unemployment, etc. Unfortunately, people and businesses and governments and municipalities will have to cut back, thus, resulting in falling prices overall. However, unfortunately, some prices where scarcities have been created, could continue to rise as shortages in those areas develop – darn.
9-18-2022 Our Most Recent Investment Performance – The bond market including municipal bonds had another tough month (and year). You can see we did very well versus the competition; however, we were a bit disappointed that our one year total return was only 1.13% (tax-free) but, still, our performance was over 400 basis points better than the Morningstar Short Term Muni category average for the period.
Stamper Capital & Investments, Inc.
Separately Managed Accounts (National Tax-Free) vs. Tax-Free Municipal Bond Indices
Annual Total Returns, Period Ended 8-31-2022
| PERIOD | Morningstar Muni Short Category | SCI Separately Managed Tax-Fee Municipal Accounts Composite Net of Fees | SCI Separately Managed Accounts Net Pre-Tax Equivalent* | Bloomberg Barclay’s 3 Year Tax-Free Muni Bond Index |
|---|---|---|---|---|
| 1 Year | -3.27% | 1.13% | 1.73% | -3.94% |
| 3 Years | -0.14% | 1.81% | 2.78% | -0.01% |
| 5 Years | 0.63% | 2.00% | 3.08% | 0.78% |
| 10 Years | 0.81% | 1.84% | 2.83% | 1.05% |
| 15 Years | 1.57% | 2.31% | 3.55% | 2.07% |
| Since Inception (1/1/1995) | N/A | 3.68% | 5.67% | N/A |
Note: Indices do not have fees (trading costs, custody fees, management fees, etc.) deducted from their returns. We now have a much more reasonable index to compare to – the Bloomberg Barclay’s 3 Year Tax-Free Municipal Index. We still aim for similar or better returns with less risk – The key with this table is that our longer term pre-tax municipal bond returns are noticeably higher than the bond market index but with What We Think is less risk – we will see when rates start to rise and/or credit quality yield spreads widen.
Please see the Disclaimer and Footnotes at the bottom of the page for more information.
* at 35% Federal tax rate
9-5-2022 Market Recap and Forecast – Our last Market Comment on 8-14-2022 where we forecast that the Counter-Trend Rebounds were likely ending and that we thought the downturns were ready to resume, turned out to have just about perfect timing. It turned out that Bitcoin peaked the day before on 8-13-2022 and fell 19.5% to now. The Dow Jones Industrial Average peaked two days later on 8-16-2022 and dropped by 7.2%. Almost all equity indices performed similarly as did other indicies/indicators that we follow. Gold peaked 8-12-2022 and has dropped another 5.1%.
Now we are looking for the downtrends in the prices of most assets to accelerate soon; we expect prices will drop quickly to their various previous levels of around June of earlier this year, and then likely take another “breather” before resuming their downtrends once again. However, given how precarious everything is, we expect surprises to be to the downside and they could be large.
8-14-2022 Our Most Recent Tax-Free Performance – The market chopped upwards in price (down in yield) pretty good and most bond categories made up some lost ground. We also had a good month and are still far ahead over the past year. Yes, the category’s return for the current twelve months is -2.45%. Unfortunately we did not capture the Index data but I’m sure it was negative also; we should have it for next month.
Stamper Capital & Investments, Inc.
Separately Managed Accounts (National Tax-Free) vs. Tax-Free Municipal Bond Indices
Annual Total Returns, Period Ended 7-31-2022
| PERIOD | Morningstar Muni Short Category | SCI Separately Managed Tax-Fee Municipal Accounts Composite Net of Fees | SCI Separately Managed Accounts Net Pre-Tax Equivalent* | Bloomberg Barclay’s 3 Year Tax-Free Muni Bond Index |
|---|---|---|---|---|
| 1 Year | -2.45% | 1.27% | 1.96% | na% |
| 3 Years | 0.32% | 1.78% | 2.73% | na% |
| 5 Years | 0.90% | 2.02% | 3.11% | na% |
| 10 Years | 0.92% | 1.84% | 2.83% | na% |
| 15 Years | 1.65% | 2.32% | 3.56% | na% |
| Since Inception (1/1/1995) | N/A | 3.69% | 5.68% | N/A |
Note: Indices do not have fees (trading costs, custody fees, management fees, etc.) deducted from their returns. We now have a much more reasonable index to compare to – the Bloomberg Barclay’s 3 Year Tax-Free Municipal Index. We still aim for similar or better returns with less risk – The key with this table is that our longer term pre-tax municipal bond returns are noticeably higher than the bond market index but with What We Think is less risk – we will see when rates start to rise and/or credit quality yield spreads widen.
Please see the Disclaimer and Footnotes at the bottom of the page for more information.
* at 35% Federal tax rate
8-14-2022 Market Recap – Most markets continued their choppy rebounds longer than we had forecast about a month ago, with some rebounding more than others. For example, Bitcoin has chopped mostly sideways. But Bonds were up more (in price, down in yield) and so were most stocks; however, these “counter-trend” rebounds are easily within normal ranges for bear markets, which we have documented several times over the years. Again, it looks to us like the next downlegs should start at any time. A couple of indicators we follow have already turned down.
Fundamentals – I was reading about an economic environment similar to what we have been through and likely are going through and will be going through. It starts with President Warren Harding – how, in an abrupt economic downturn, President Harding, cut taxes and cut government spending rather dramatically and reduced regulations to combat that downturn and it resulted in the huge final run-up – “The Roaring 20’s” – to the 1929 Stock Market Top. Then, after the 1929 Stock Market Top in the early stages of the stock crash/economic downturn, new President Roosevelt raised taxes and government spending substantially and further down went stock prices and into The Depression we went – and it lasted a long time. We have had pretty much that scenario so far – President Trump lowered taxes and eased business conditions/regulations and we had an economic boom, that went into the next Administration’s term. The new Administration has focused on “The Green Economy” which has meant curtailing different areas of our economy. Also, they are just now Raising Taxes – The Congress is just now passing legislation that will raise taxes. Not only that, but they plan to fund many thousand IRS agents. Regulations have also been stepped up. Similarly to what happened about 100 years ago – after the 1929 stock market Peak and the first leg of the corresponding Crash and The Great Depression – we believe these actions are likely going to be “contractionary,” unfortunately. Of course, we will see. Note, we are not neccessarily blaming any political party or ideology – it just seems things like these happen during the particular portions of the various economic cycles.
7-17-2022 Our Most Recent Tax-Free Performance – The short end of the bond market, including the Municipal Bond market got hit again (as we forecated below) and our lead over the Short Muni Index and the Morningstar Muni Short Category Average increased. Yes, those are negative total returns for the Index and the Category Average. We are still positive for the rolling twelve months and put in pretty nice returns over the longer rolling periods!
Stamper Capital & Investments, Inc.
Separately Managed Accounts (National Tax-Free) vs. Tax-Free Municipal Bond Indices
Annual Total Returns, Period Ended 6-30-2022
| PERIOD | Morningstar Muni Short Category | SCI Separately Managed Tax-Fee Municipal Accounts Composite Net of Fees | SCI Separately Managed Accounts Net Pre-Tax Equivalent* | Bloomberg Barclay’s 3 Year Tax-Free Muni Bond Index |
|---|---|---|---|---|
| 1 Year | -3.20% | 1.12% | 1.72% | -3.46% |
| 3 Years | 0.12% | 1.78% | 2.74% | 0.33% |
| 5 Years | 0.76% | 2.04% | 3.13% | 0.99% |
| 10 Years | 0.87% | 1.85% | 2.84% | 1.11% |
| 15 Years | 1.61% | 2.33% | 3.59% | 2.17% |
| Since Inception (1/1/1995) | N/A | 3.70% | 5.69% | N/A |
Note: Indices do not have fees (trading costs, custody fees, management fees, etc.) deducted from their returns. We now have a much more reasonable index to compare to – the Bloomberg Barclay’s 3 Year Tax-Free Municipal Index. We still aim for similar or better returns with less risk – The key with this table is that our longer term pre-tax municipal bond returns are noticeably higher than the bond market index but with What We Think is less risk – we will see when rates start to rise and/or credit quality yield spreads widen.
Please see the Disclaimer and Footnotes at the bottom of the page for more information.
* at 35% Federal tax rate
7-11-2022 – Counter-Trend Rally Looks To Be Ending – Back on 6-13-2022 (quoted from below) we said: “Please note that while we expect asset prices to drop down to the Covid Lows of March 2020 before major long term (“counter-trend”) bounces, we do expect there will be some sharp intermediate term counter-trend rallies; however, we think it will be likely very dangerous to try to trade those bounces. Be careful out there.” And, that is what we got an intermediate, choppy rally “counter-trend” to the big declines we’ve seen. However, other than its beginning, the rises have not been that sharp but, after the initial rebounds, they have mostly chopped sideways, thus, losing momentum. To us, the timidity of the counter trend rally will likely nicely dovetail or result in a very large drop upon resumption of the downtrends, which we think are almost upon us now. Importantly, because the majority seem not to know what prices are going down, the resumption of these downtrends in prices are in stocks, “cybercurrencies,” and commodities with real estate (single family houses) to join in with real estate equity vehicles (see next paragraph).
We documented below that real estate investment trusts and real estate ETF’s are also in price downtrends. We think the big drops in prices of all the asset categories we are forecasting, could be inconjunction with continuing rises in interest rates (rates up, bond prices down, anything heavily financed like real estate and even commodities down) before they (bonds) have their own counter-trend rally (rates downward, prices up) at least at the longer end of the curve. We think the short end of the curve will likley just ratchet upward.
Importantly, the One Month U.S. T-bill rate has gone up from essentially zero% one year ago to 1.56% today in a pretty constant rise. An example of the impact of this rise is that these and other short rates are the basis for adjustable rate mortgage payments which will be (actually already are) seeing their dollar amounts rise (along with short term rates); thus, putting more pressure on real estate prices along with the increased cost of using long term real estate financing. A thirty year mortage is now at 5.87% – its lowest over the past year was only 3%! so it has almost doubled. Worse, because you don’t have to refinance to feel its impact are Adjustable Rate Mortgages – you have to make the higher payment. Importantly, Five Year Adjustable Mortgage rates are now 4.3% – the lowest over the past year was 2.82% – so that is quite a rise. Unfortunately, as peoples mortgage costs/payments rise, they will have less cash for other things – we think we are seeing that in the prices of used goods we track on Ebay and on Craigslist. It also results in declines in sales volumes (activity) which we are also seeing in lots of categories.
So, unfortunately, it seems the downturn we are forecasting in asset prices and in the economy is continuing and we expect it to be more noteable in the future.
(Please note: While we expect prices of almost all assets to plummet in price, certain items whose price is currently more determined by a decline in supply could go up at the very same time – such items could be gasoline and/or foods, etc.)
6-26-2022 – Some Recent News Stories on The Recent Drop in Wealth from Stock and Crypto Price Declines:
Retirement savers lose over $3 trillion in stock market retreat, AOL, 6-26-2022 – “This year, the S&P 500 has slumped over 20%, the Dow Jones Industrial Average has fallen close to 16%, and the Nasdaq Composite has dropped more than 28%. As a result, Americans lost $1.4 trillion in their 401(k) accounts and another $2 trillion in IRAs, according to Alicia Munnell, director of the Center for Retirement Research at Boston College.”
CNBC, 6-15-2022 – “The most popular cryptocurrency has shed about 70% of its value since hitting an all-time high of roughly $69,000 in November. The entire crypto market is feeling similar pain. The overall market capitalization of crypto assets has dropped to less than $1 trillion from its November 2021 peak of $3 trillion [ = a $2 trillion drop].“
So, unfortunately, losses are about $5 trillion = $3 trillion in the stock market plus $2 trillion in crypto “currencies” so far & this does not include the drop in the value of the bond markets, which is considerably larger, but which, at least as far as the general populace is concerned, is felt less immediately. We believe just like the perceived increase in wealth rippled volumes, prices, salaries, etc. upward, this plummet in wealth will ripple into the real economy pushing volumes, asset prices, salaries, etc. downward causing a recession (which we are likely already in) and worse, unfortunately.
6-16-2022 Our Most Recent Tax-Free Performance – You can see that we have continued to do very well & we note that our outperformance is with much less volatility than the averages – you can see that if you look at our performance relative to their’s over different time periods down below.
Stamper Capital & Investments, Inc.
Separately Managed Accounts (National Tax-Free) vs. Tax-Free Municipal Bond Indices
Annual Total Returns, Period Ended 5-31-2022
| PERIOD | Morningstar Muni Short Category | SCI Separately Managed Tax-Fee Municipal Accounts Composite Net of Fees | SCI Separately Managed Accounts Net Pre-Tax Equivalent* | Bloomberg Barclay’s 3 Year Tax-Free Muni Bond Index |
|---|---|---|---|---|
| 1 Year | -2.78% | 1.20% | 1.85% | -3.38% |
| 3 Years | 0.33% | 1.84% | 2.84% | 0.52% |
| 5 Years | 0.80% | 2.05% | 3.15% | 0.95% |
| 10 Years | 0.89% | 1.85% | 2.85% | 1.13% |
| 15 Years | 1.63% | 2.34% | 3.60% | 2.18% |
| Since Inception (1/1/1995) | N/A | 3.71% | 5.70% | N/A |
Note: Indices do not have fees (trading costs, custody fees, management fees, etc.) deducted from their returns. We now have a much more reasonable index to compare to – the Bloomberg Barclay’s 3 Year Tax-Free Municipal Index. We still aim for similar or better returns with less risk – The key with this table is that our longer term pre-tax municipal bond returns are noticeably higher than the bond market index but with What We Think is less risk – we will see when rates start to rise and/or credit quality yield spreads widen.
Please see the Disclaimer and Footnotes at the bottom of the page for more information.
* at 35% Federal tax rate
6-13-2022 – That was quick! Wow, one day after our previous post about “Next Leg of the Downturn(s) having Started,” essentially every index and category – stocks, bonds, precious metals, and real estate (ETF’s, and CryptoCurrencies dropped precipitously and put in new “Lower Lows” since their All-Time highs. The largest drops by far were Bitcoin and Ethereum dropping about 15%! Drops of prices other asset classes were around 3% to 5%.
Today, the Dow Industrials dropped 2.79%, the S&P 500 by 3.88%, the NASDAQ by 4.68%, the Wilshire 5000 by 4.18% and the Russell 2000 (“RUT” ETF) dropped by 3.95%. The RUT was the only equity indice of all that we checked that has not put in a new “Lower Low” but it is just a few points away. Also, The S&P 500 is down by over 20% so it is officially in a “Bear Market.”
We did not specifically talk about interest rates last time but we did talk about bond prices plummeting and if bond prices drop, that means interest rates (yields) have risen. And, importantly, the bond market got hammered today too. In fact, the 10 year and 30 year U.S. Treasuries put in Lower Lows (prices, Higher High in yields) today. Also, the High Yield Municipal Bonds (“HYD” ETF) plummeted over 4.5%, a huge move in that category, to create a similar price Lower Low; thus, catching up in pattern/form to the Junk Taxable High Yield Bonds (“JNK” ETF) which fell similarly but was already at a “Lower Low” before today’s price drop. So, the price action was just as we forecasted.
Also, related to interest rates and going along with our forecast for a bear market with huge drops in real estate prices, the 30 Year Mortgage Rate (financing cost for a 30 year mortgage on a house) spiked up to 6.13%; it was just 3.25% at the beginning of 2022 and its All-Time low was below 3% in late 2020. Similarly Real Estate Market ETFs “XHB,” “IYR,” and “VNQ,” for example, that we have been following, dropped from around 4.25% to by 5% today. XHB caught up to the other two in putting in a new “Lower Low” since its All-time top. Thus, real estate’s trend is down, based on our methods.
Precious metals also had large drops today with gold dropping around $50 and by about 3% and Silver dropping by a higher percentage. Remember most people finance their holdings of precious metals so if interest rates shoot up, their prices drop (normally) due to the increased financing costs. VanEck Gold Miners ETF (“GDX”) dropped similarly. Note none of these put int new “Lower Lows” from their All-time highs this time but they continue to head that direction and are now not that far away. If/when they break into that position, it will confirm a larger trend down for them as has been confirmed for the equities, bonds, and crypto, etc. according to our methods.
Please note that while we expect asset prices to drop down to the Covid Lows of March 2020 before major long term (“counter-trend”) bounces, we do expect there will be some sharp intermediate term counter-trend rallies; however, we think it will be likely very dangerous to try to trade those bounces. Be careful out there.
6-12-2022 – Looks to us Like the Next Leg of the Downturn(s) has Started: As forecast Bitcoin and Ethereum have broken down through the choppy sideways shelfs they were on to put in “Lower Lows” since their All-time highs. Bitcoin is now down to 27,054. Looks to us like the next major support is around 18,794 which is 30% below where it is now; we would not be surprised for Bitcoin to fall fairly rapidly to around that level. Ethereum USD is a bit ahead of Bitcoin in leading the price charge downward. It is currently at 1,459; next major support looks to us to be around 769 – to get there would be a 47% drop; again, we would not be surprised to see it drop fairly quickly to that level.
Also leading the charge as we forecast below are the high yield municipal bonds (“HYD” ETF) and the junk taxable bonds (“JNK” ETF) (both categories of which we were mutual fund Portfolio Managers of for many years). The high yield muni’s have continued their drop but are not yet at a “lower low:” however, the junk taxables are at a “lower low” (since their All-Time Top). Support for the junk taxables is at the March 2020 Covid Low (pre-stimulus) which is down about 7.5% from current levels. However, it looks to us like the High Yield Municipal bonds have further to fall (and less possible resistance), about 14% down to their March 2020 Covid Low.
Also, as forecast earlier below, the equities have started lower with fairly large drops over the past few days. Importantly, the Wilshire 5000, the largest/broadest equity index has broken down to a new Lower Low since its All-Time Top; most other equity indices have yet to do so but we think they will fairly soon. Also, as we indicated below, Real Estate EFTs (and individual properties; basically the real estate markets) are following the same patterns. In fact, as forecasted below, Real Estate EFT’s “IYR” and “VNQ” have also broken down into new “Lower Lows” since their All-Time Tops. “XHB” while heading the same direction has not, yet. We expect this trend and its drops to be much more notable (in the media) soon.
Looking foward, we expect essentially all categories mentioned to continue their drops to put in new “Lower Lows.” We also expect lower prices for precious metals (as outlined previously). Unfortunately, we are expecting rather huge price drop across the board similarly to what we saw in the Financial Crash (after the Housing Bubble) from around 2007 down into 2009. Of course, nothing is absolutely certain – we will be watching to see what happens in real-time. Be careful out there.
6-6-2022 Another Short Update – The Counter-Trend rallies in Stocks, Junk bonds, Crypto and precious metals over the past few weeks look to be ending about now. Thus, we are forecasting a resumption of the downtrends. We have already seen indications in high yield municipal bonds (“HYD” ETF) and junk taxable bonds (“JNK” ETF) which have already turned down a bit. Bitcoin didn’t really have much of a counter-trend rally but chopped sideways and it looks to us like it is ready to fall off of that “shelf” and resume its downtrend. As for stocks it looks like the NASDAQ and the Russell 2000 (“RUT” ETF) are leading the pack with small drops in place as of today. Hold onto your hats as we expect these drops to be notably larger that those from the top so far. Of course, these will all be “lower lows” keeping the trend of “lower lows” and “lower highs” intact, which will mean the all-time highs of the Super Top were in as forecasted below.
5-14-2022 Our Most Recent Tax-Free Performance – Yes, those are rather large negative total returns for the Category Average and the Index over the past twelve months; and, very low returns for them over the current three years and five years for the Category and the Index. We have said that we were taking quite a bit Less Risk and now it is showing rather dramatically in that our “realized returns” are much more stable and positive (on a 12 month and longer basis). This situation is similar to when we were running The Strategic Muni (“Strat Muni”) Bond Fund but in that case we had Mornnigstar providing the risk-adjusted rating. So, the bond market has continued to trade off, even at the short end (for normal bonds). Fortunately, we performed very well, and, maybe more importantly, the supply of bonds of the specific types that we like to buy has recently increased and at better pricing! So, we expect to continue doing well.
Stamper Capital & Investments, Inc.
Separately Managed Accounts (National Tax-Free) vs. Tax-Free Municipal Bond Indices
Annual Total Returns, Period Ended 4-30-2022
| PERIOD | Morningstar Muni Short Category | SCI Separately Managed Tax-Fee Municipal Accounts Composite Net of Fees | SCI Separately Managed Accounts Net Pre-Tax Equivalent* | Bloomberg Barclay’s 3 Year Tax-Free Muni Bond Index |
|---|---|---|---|---|
| 1 Year | -3.38% | 1.15% | 1.76% | -5.20% |
| 3 Years | 0.27% | 1.87% | 2.88% | 0.28% |
| 5 Years | 0.74% | 2.06% | 3.17% | 1.36% |
| 10 Years | 0.83% | 1.85% | 2.85% | 1.82% |
| 15 Years | 1.59% | 2.34% | 3.61% | 2.48% |
| Since Inception (1/1/1995) | N/A | 3.71% | 5.71% | N/A |
Note: Indices do not have fees (trading costs, custody fees, management fees, etc.) deducted from their returns. We now have a much more reasonable index to compare to – the Bloomberg Barclay’s 3 Year Tax-Free Municipal Index. We still aim for similar or better returns with less risk – The key with this table is that our longer term pre-tax municipal bond returns are noticeably higher than the bond market index but with What We Think is less risk – we will see when rates start to rise and/or credit quality yield spreads widen.
Please see the Disclaimer and Footnotes at the bottom of the page for more information.
* at 35% Federal tax rate
5-1-2022 update – Our Forecasts are on track – “Lowest Lows” from All-Time Tops are most likely very telling (Based on closing prices)
Slight Laggards
Dow Jones Industrial Avg.’s All-Time High is 36,800 on 1-4-2022. It is at 32,977 on 4-29-2022 = 10.4% drop. Note, this is not its Lowest Low since its All-Time Top (like the others below will be), but almost – so not quite a “lower low” but its price is heading that way and is close. Thus, the Dow Industrials is a laggard but only slightly and it is the only major domestic equity indice that isn’t at its Lowest Low since their All-Time Tops!
We are including Bitcoin as we have been in the previous pages. Bitcoin’s All-Time High is 67,802 on 11-9-2021. It is now on 5-1-2022 (Saturday) at 42,030 = 38% drop. Similarly, to the Dow Industrials, Bitcoin is not at the Lowest Low since its All-Time Top but it is heading that way and is close. No Bitcoin (and other cyber “currencies”) isn’t an equity or an equity index, etc. but, to us, its fortune’s are indicative of the other markets we are forecasting. This one is in a “Bear Market!”
“Lowest Lows” from their All-Time Tops!
“Lowest Low” in a series of lower highs and lower lows – Note that the Lowest Lows since their All-Time Tops as documented below are (mostly) within the last few days – meaning the trend is definitely downward, unfortunately.
S&P 500’s All Time High is on 1-4-2022 at 4,794. It’s Lowest Low since its ALL-TIME Top is 4,132 on 4-29-2022 = 13.8% drop.
Wilshire 5000 Total Market Full Cap Index’ (the most inclusive stock index) All-Time High is 48,952 on 11-8-2021. Its Lowest Low since then is 41,344 on 4-29-2022 = 15.5% drop.
The NASDAQ Comp’s All-Time high is on 11-19-2021 at 16,057. Its Lowest Low since then is 4-29-2022 at 12,335 = 23% drop. Note: anything equal to or more than a 20% drop is defined as a “Bear Market.”
The NASDAQ 100’s All-Time high 12-27-2021 at 16,560. Its Lowest Low since its All-Time Top is on 4-29-2022 at 12,891 = 22.16% drop – so in a “Bear Market.”
The Russell 2000’s (large small cap index) All-Time Top is at 2,443 on 11-8-2021. Its Lowest Low since then is 1,864 on 4-29-2022 = 23.7% drop – so in a “Bear Market.”
The “Leaders” of this huge cycle in terms of time (peaked first)
“HYD” high yield municipal bond ETF’s All-time high was on 7-1-2012 (yes back in 2012!) at $65.94 – so several years before the rest. It has had a few highs almost at that level since then. The most recent was on 7-3-2021 at $63.90. Its Lowest low since then is $54.96 on 4-29-2022 = 13.99% drop (and larger percent drops from earlier tops).
“JNK” junk bond ETF’s All-time high of $125.19 was on 4-1-2014 so also years before the rest. Its most recent rebound high since then was $110.11 on 9-15-202.1 Its Lowest Low 97.61 on 4-29-2022 = 11.35% drop from the most recent top (and larger percent drops from earlier tops).
The Leaders in this cycle in terms of % drop
NetFlix (“NFLX”) – All-Time high $691.69 on 11-17-2021. Its Lowest Low since its All-Time Top is $190.36 on 4-29-2022 = 72.24% drop! Whoa! That is huge. We note NetFlix is one of the “FANNG” stocks that led the upcycle of the “All Everything Top.” At one point we were calling this top the “E-Commerce Top” because the FANNG and other e-commerce companies lead the way up. But now maybe we should label the drop, the “E-Commerce Drop” since the category seems to be leading the drop, unfortunately.
Meta Platforms (i.e. Facebook “FB”) All-Time Top 382.18 on 9-7-2021. Its Lowest Low since its All-Time High is on 4-27-2022 at 174.95 = 54% drop!
Amazon (“AMZN”) All-Time High 7-9-2021 at 3,719.34. Its Lowest Low since then is on 4-29-2022 at 2,485.63 = 33.17% Drop.
Alphabet (i.e. Google “Goog”) All-Time High 11-18-2021 at 3,014.18. Its Lowest Low since its All-Time High is on 4-29-2022 at 2,299.33 = 23.79% drop.
MicroSoft (“MSFT”) All-Time Top 11-19-2021 at 343.11. Its Lowest Low since then is on 4-26-2022 at 270.22 = 20.66% drop.
A much smaller E-commerce company that is not nearly as well known as the above in included because its price performance is indicative of the sector and the markets: Carvana “CVNA” (sells autos over the internet) had its All-Time Top on 8-10-2021 at 370.10. Since then its Lowest Low is on 4-29-2022 at 57.96 = 84% drop!
(Note Apple’s profile is more similar to the Real Estate ETF’s below. I think it will also catch up, unfortunately.)
Real Estate Indicators following the same pattern
SPDR S&P Homebuilders ETF “XHB”s All-Time High is on 12-10-2021 at $86.27. Its Lowest Low since its All-Time Top is 60.90 on 4-18-2022 (61.29 on 4-29-2022) = 29.41% drop.
iShares U.S. Real Estate ETF “IYR”s All-Time High is on 12-31-2022 at 116.14. This one is interesting in that its Lowest Low since its All-Time Top was on 2-23-2022 at 99.21 = 14.77% drop; however, since then it has rallied notably to 112.38 on 4-20-2022 before starting back down again to 103.75 on 4-29-2022. So, this index does not exactly fit the cyclic nature of the rest of the indices and stocks I am highlighting. However, I believe it will catch up shortly. I see that “VNQ” has a similar profile to “IYR.”
It makes sense to us that the homebuilder’s stock prices decline first ahead of other real estate sectors which we think will very likely follow. This situation is what we saw at the top of the Housing Bubble (2006-2008) before the Financial Crash down into 2009-2011 (See our Analysis (in real time) in calling the Housing Bubble top). Stocks bottomed in 2009 with housing prices bottoming a couple of years later.
Interest Rates Rising = Bond Prices Dropping (and prices dropping in most asset classes)
The Thirty Year Year U.S. Treasury Long Bond – All-Time Yield Low is 1.18% on 4-22-2020 – geeze. It had a higher low on 11-21-2021 at 1.765% – so had already risen quite a lot. Now it is at 2.94% and had been a bit over 3% last week. That is a huge rise but we think real damage to other asset prices will be (or has been) from short rates rising.
The yield rise the U.S. Ten year is similar to that of the U.S. Thirty year. Its All-Time low was on 7-31-2020 at 0.508%. It had a higher low on 7-31-2021 of 1.184% and now it is at 2.889% – quite a substantial rise overall and we think a lot longer to go.
The Belly of the Curve – The entire curve shifted up in yield with the shift in the short end of the yield curve lagging the rise of the long end.
The Three Month U.S. T-Bill rate – All-Time Low was on 3-23-2020 at 0.003% wow! It essentially started its rise 12-28-2021 rising off the floor from 0.05% and now it is at 0.836%. That is still low but it is a huge rise (0.836%/0.05% = 16.72x!). Importantly, lots of assets are financed with debt whose interest rates float with short term interest rates.
We believe the last yield to really shoot up will be that of the One Month Treasury Bill which will certainly shoot up when the Federal Reserve moves up the Fed Funds rate very soon. It as already gone up from around zero to about 0.30% over the past few of months.
Also note Credit Quality Yield Spreads (the difference in yields between the highest quality bonds (U.S. Treasuries) and lower quality bonds (high yield bonds and/or junk bonds) have widened dramatically over the past year or so as evidenced by the price drops (prices down means yields up) of junk bonds (evidenced by “JNK”s price action above) and high yield municipal bonds (evidenced by “HYD”’s price action above). So in the case of yields of lower quality bonds (financing lower quality companies and investments and commercial and other types of real estate) not only is the index their yields are spread off of rising, but the spread differential is also widening. Thus, for lower quality assets, the cost of financing has been hit by a double whammy, which has cause their prices to drop. We expect these trends to continue, unfortunately.
Our Conclusion
As soon as the Dow Industrials joins the rest at its own Lowest low since its own All-Time top, “The All-Everything All-Time Top” will certainly be ‘In’” – in fact, it is so close now, it almost certainly is, already, unfortunately.
_ _ _
4-17-2022 Our Most Recent Tax-Free Performance – The general bond market sell-off, that we forecasted and have been documenting in these pages, finally accelerated with its worst quarter in a couple decades. You can see in the Performance Table below that we still had a fairly nice Positive total return over the last twelve months; however, those are pretty large Negative returns for the Muni Short Category and the Muni Short Term bond index. So, we did exceptionally well for the current twelve months, and that brought up our relative long term performance substantially also. In the table you can see that we beat the Category and even the Index (that has no fees nor trading costs subtracted out of its performance) over all time periods listed. The quarter just passed reminds us of when we managed The Fund (Venture/Davis/Evergreen/Wells Fargo Strategic Municipal Bond fund – recently re-named Allspring Strategic Municipal Bond Fund – same Class Symbols (I was its Portfolio Manager for 20 years ending 7-31-2010) in the very tough bond market of 1994 when “Strat Muni” (then named Venture Muni (+) Plus) was the best performing Municipal Bond Mutual Fund in all municipal bond mutual fund categories out of approximately 800 competitors – See: “Managing Munis From a Corporate Credits Perspective,” THE BOND BUYER 09-21-1994 and Stamper Capital’s Performance and Awards .
l4-17-2022 Our Most Recent Tax-Free Performance – The general bond market sell-off, that we forecasted and have been documenting in these pages, finally accelerated with its worst quarter in a couple decades. You can see in the Performance Table below that we still had a fairly nice Positive total return over the last twelve months; however, those are pretty large Negative returns for the Muni Short Category and the Muni Short Term bond index. So, we did exceptionally well for the current twelve months, and that brought up our relative long term performance substantially also. In the table you can see that we beat the Category and even the Index (that has no fees nor trading costs subtracted out of its performance) over all time periods listed. The quarter just passed reminds us of when we managed The Fund (Venture/Davis/Evergreen/Wells Fargo Strategic Municipal Bond fund – recently re-named Allspring Strategic Municipal Bond Fund – same Class Symbols (I was its Portfolio Manager for 20 years ending 7-31-2010) in the very tough bond market of 1994 when “Strat Muni” (then named Venture Muni (+) Plus) was the best performing Municipal Bond Mutual Fund in all municipal bond mutual fund categories out of approximately 800 competitors – See: “Managing Munis From a Corporate Credits Perspective,” THE BOND BUYER 09-21-1994 and Stamper Capital’s Performance and Awards . ssss
4-17-2022 Our Most Recent Tax-Free Performance – The general bond market sell-off, that we forecasted and have been documenting in these pages, finally accelerated with its worst quarter in a couple decades. You can see in the Performance Table below that we still had a fairly nice Positive total return over the last twelve months; however, those are pretty large Negative returns for the Muni Short Category and the Muni Short Term bond index. So, we did exceptionally well for the current twelve months, and that brought up our relative long term performance substantially also. In the table you can see that we beat the Category and even the Index (that has no fees nor trading costs subtracted out of its performance) over all time periods listed. The quarter just passed reminds us of when we managed The Fund (Venture/Davis/Evergreen/Wells Fargo Strategic Municipal Bond fund – recently re-named Allspring Strategic Municipal Bond Fund – same Class Symbols (I was its Portfolio Manager for 20 years ending 7-31-2010) in the very tough bond market of 1994 when “Strat Muni” (then named Venture Muni (+) Plus) was the best performing Municipal Bond Mutual Fund in all municipal bond mutual fund categories out of approximately 800 competitors – See: “Managing Munis From a Corporate Credits Perspective,” THE BOND BUYER 09-21-1994 and Stamper Capital’s Performance and Awards .
Stamper Capital & Investments, Inc.
Separately Managed Accounts (National Tax-Free) vs. Tax-Free Municipal Bond Indices
Annual Total Returns, Period Ended 3-31-2022
| PERIOD | Morningstar Muni Short Category | SCI Separately Managed Tax-Fee Municipal Accounts Composite Net of Fees | SCI Separately Managed Accounts Net Pre-Tax Equivalent* | Bloomberg Barclay’s 3 Year Tax-Free Muni Bond Index |
|---|---|---|---|---|
| 1 Year | -2.37% | 1.13% | 1.74% | -3.42% |
| 3 Years | 0.59% | 1.91% | 2.94% | 0.64% |
| 5 Years | 1.00% | 2.07% | 3.19% | 1.06% |
| 10 Years | 0.97% | 1.86% | 2.86% | 1.15% |
| 15 Years | 1.66% | 2.36% | 3.63% | 2.12% |
| Since Inception (1/1/1995) | N/A | 3.72% | 5.72% | N/A |
Note: Indices do not have fees (trading costs, custody fees, management fees, etc.) deducted from their returns. We now have a much more reasonable index to compare to – the Bloomberg Barclay’s 3 Year Tax-Free Municipal Index. We still aim for similar or better returns with less risk – The key with this table is that our longer term pre-tax municipal bond returns are noticeably higher than the bond market index but with What We Think is less risk – we will see when rates start to rise and/or credit quality yield spreads widen.
Please see the Disclaimer and Footnotes at the bottom of the page for more information.
* at 35% Federal tax rate
3-30-2022 Just a short update – The equity rebound has continued but is still a pattern of lower lows and lower highs with some indices like the Dow Jones Industrial Average being closer to their All-Time Highs. Others such as the Russell 2000 are much lower. Today, most indices were flat to down slightly, but the Russell 2000 was down almost 2%. So far, we’ve designated the Russell 2000 (and the junk bond tax-free and taxable ETF mutual funds) as the Leader in this cycle. If this situation holds true, it looks to us as if the next downward drops (across the board) are about to start. Of course, we will see.
3-18-2022 Our Most Recent Tax-Free Performance – The municipal bond market stayed flat at the new lower levels (higher yields); thus, our recent (and long term) outperformance has continued. The recent outperformance is explained mostly by defensive security selection, high cash balances in a negative return market (because we were having so much difficulty purchasing the defensive securities we desired at what we thought were reasonable prices), and other factors. You can see we did extremely well over the past twelve months, which brought or kept our longer relative performance up above the category average and the index over all time periods, especially since they had negative total returns over the past twelve months, while our tax-free return (after fees) was a healthy 1.30%.
Stamper Capital & Investments, Inc.
Separately Managed Accounts (National Tax-Free) vs. Tax-Free Municipal Bond Indices
Annual Total Returns, Period Ended 2-28-2022
| PERIOD | Morningstar Muni Short Category | SCI Separately Managed Tax-Fee Municipal Accounts Composite Net of Fees | SCI Separately Managed Accounts Net Pre-Tax Equivalent* | Bloomberg Barclay’s 3 Year Tax-Free Muni Bond Index |
|---|---|---|---|---|
| 1 Year | -0.98% | 1.30% | 1.99% | -1.41% |
| 3 Years | 1.16% | 2.00% | 3.08% | 1.38% |
| 5 Years | 1.28% | 2.14% | 3.29% | 1.41% |
| 10 Years | 1.06% | 1.88% | 2.89% | 1.31% |
| 15 Years | 1.77% | 2.38% | 3.67% | 2.31% |
| Since Inception (1/1/1995) | N/A | 3.73% | 5.74% | N/A |
Note: Indices do not have fees (trading costs, custody fees, management fees, etc.) deducted from their returns. We now have a much more reasonable index to compare to – the Bloomberg Barclay’s 3 Year Tax-Free Municipal Index. We still aim for similar or better returns with less risk – The key with this table is that our longer term pre-tax municipal bond returns are noticeably higher than the bond market index but with What We Think is less risk – we will see when rates start to rise and/or credit quality yield spreads widen.
Please see the Disclaimer and Footnotes at the bottom of the page for more information.
* at 35% Federal tax rate
2-18-2022 Our Most Recent Tax-Free Performance – As you can see in the table below, the short term municipal tax-free category had a rough go over the last twelve months. It was especially rough in December 2021 and even more so this January 2022. We finally hit the ball out of the park, relatively speaking, with a +1.49% return compared to -1.19% for the Morningstar Short Term Municipal Category, twelve months ending 1-31-2022. And, we did better in all the other periods too. We had a high cash position because we were having such a difficult time finding the bonds we wanted at good prices (as we documented previously). Looking forward, we think interest rates will continue to rise – you can follow that discussion in our other commentary (above in the future, and below).
Stamper Capital & Investments, Inc.
Separately Managed Accounts (National Tax-Free) vs. Tax-Free Municipal Bond Indices
Annual Total Returns, Period Ended 1-31-2022
| PERIOD | Morningstar Muni Short Category | SCI Separately Managed Tax-Fee Municipal Accounts Composite Net of Fees | SCI Separately Managed Accounts Net Pre-Tax Equivalent* | Bloomberg Barclay’s 3 Year Tax-Free Muni Bond Index |
|---|---|---|---|---|
| 1 Year | -1.19% | 1.49% | 2.29% | -1.49% |
| 3 Years | 1.36% | 2.11% | 3.25% | 1.56% |
| 5 Years | 1.42% | 2.17% | 3.34% | 1.58% |
| 10 Years | 1.11% | 1.90% | 2.92% | 1.37% |
| 15 Years | 1.83% | 2.41% | 3.71% | 2.38% |
| Since Inception (1/1/1995) | N/A | 3.74% | 5.76% | N/A |
Note: Indices do not have fees (trading costs, custody fees, management fees, etc.) deducted from their returns. We now have a much more reasonable index to compare to – the Bloomberg Barclay’s 3 Year Tax-Free Municipal Index. We still aim for similar or better returns with less risk – The key with this table is that our longer term pre-tax municipal bond returns are noticeably higher than the bond market index but with What We Think is less risk – we will see when rates start to rise and/or credit quality yield spreads widen.
Please see the Disclaimer and Footnotes at the bottom of the page for more information.
* at 35% Federal tax rate
2-7-2022 – From All-Time Tops They Drop – Facebook‘s (“FB,” recently renamed Meta Platforms, Inc. ) stock price plummeted by 26% in one day! (on Thursday, 2-3-2022). Since that time (two trading days) it has dropped another 5.5% or so. The Company’s stock price had peaked on 9-5-2021 at $379 (closing basis). So, from its All-Time Top it has fallen by 40% – Wow. This price drop (and others) strengthens our forecast that “The Top of the Super Peak is ‘In'” (which means Big Drops and Big Retracements (but smaller than the drops) ahead, with “net” large negative returns as was experienced in the “Tech Wreck” (2000-2003) “The Financial Crash” (2007-2009).) Still, we feel we need another drop to lower lows in the indices for confirmation of that statement.
Another “biggie” with a similar drop is Netflix (“NFLX”) which has dropped almost 47% from its All-Time top on 10-29-2021 to a low on 1-26-2022. Of course, these are two of the few “FANNG” (spelled a couple of different ways depending upon which few stocks are included) that so prominently inflated the Super Bubble, to the point that another possible name we came up with (down below) is the “E-commerce Bubble” since they are all related to E-Commerce.
Also bolstering our forecast is that the Russell 2000 small cap index (“RUT”) fell by 20.9% down to its 1-27-2022 low from its All-Time top on 11-8-2021. A 20% drop puts it officially in a “Bear Market.” Still, for us, the RUT needs another downleg to a lower low to confirm the “Top is in” but it we are getting closer to that point. We need similar downlegs as well in the other indices to their new lower lows for confirmation but the forecast is on schedule.
1-26-2022 – Our most recent tax-free performance – Our accounts broke out well ahead of the averages for the year ending 12-31-2022. The chart shows how both the Morningstar Muni Short Category and the 3-Year Tax-Free Muni Bond Index had very small, but still positive returns and how our average Federally Tax-Free return was about 6x to 4x higher, respectively. It was a tough year for short bonds as yields for most bonds for most of the year were very low and then, their interest rates began their rise in the third quarter, pushing the prices of most bonds downward. You can see we also did very well over the longer term periods.
Stamper Capital & Investments, Inc.
Separately Managed Accounts (National Tax-Free) vs. Tax-Free Municipal Bond Indices
Annual Total Returns, Period Ended 12-31-2021
| PERIOD | Morningstar Muni Short Category | SCI Separately Managed Tax-Fee Municipal Accounts Composite Net of Fees | SCI Separately Managed Accounts Net Pre-Tax Equivalent* | Bloomberg Barclay’s 3 Year Tax-Free Muni Bond Index |
|---|---|---|---|---|
| 1 Year | 0.25% | 1.60% | 2.45% | 0.40% |
| 3 Years | 1.93% | 2.15% | 3.31% | 2.34% |
| 5 Years | 1.75% | 2.19% | 3.37% | 2.07% |
| 10 Years | 1.29% | 1.92% | 2.96% | 1.60% |
| 15 Years | 1.90% | 2.43% | 3.74% | 2.49% |
| Since Inception (1/1/1995) | N/A | 3.75% | 5.77% | N/A |
Note: Indices do not have fees (trading costs, custody fees, management fees, etc.) deducted from their returns. We now have a much more reasonable index to compare to – the Bloomberg Barclay’s 3 Year Tax-Free Municipal Index. We still aim for similar or better returns with less risk – The key with this table is that our longer term pre-tax municipal bond returns are noticeably higher than the bond market index but with What We Think is less risk – we will see when rates start to rise and/or credit quality yield spreads widen.
Please see the Disclaimer and Footnotes at the bottom of the page for more information.
* at 35% Federal tax rate
1/24/2022 – Our Forecast has Strengthened – Stocks (and Cybercurrencies) have continued to drop from our forecasted All-Time Tops of around 11/8/2021 for most indices and the first week of January 2022 for the few others, per our previous discussions (below). A good example is the Dow Jones Industrial Average. Today, Monday 1/24/2022, the Dow Industrials dropped 1,052 points, or 3.17% down to 33,213 intra-day. Its All-time top (closing) was 36,800; so the drop to today’s intra-day low was by 3,587 points or by 10.26%. Other equity indices dropped similarly (with the Russell 2000 ahead of the pack as discussed previously) – all putting in notable lower lows – so the trend in equities continues to be down. Importantly, the equity indices also rebounded from their intra-day lows to slight positive closes – thus, having substantial snap-back rallies. For example, from its intra-day low the Dow Industrials rebounded by 1,151 points or by 3.47%. That rebound is substantial but perfectly in line with a counter-trend correction in Bear Market. We believe the rebound is nearly over or we could see some similar size down then up gyrations before the downtrend resumes. If so, those levels will be the “lower highs” we are looking for to confirm that the trend is downward, which is what we are forecasting.
Cybercurrencies are trending down along with stocks as forecasted but at a faster speed and with larger drops. From its 67,802 peak on 11-9-2021 (closing price) Bitcoin has dropped by 49%!!! down to 34,652 (intra-day) on 1/24/2022. Over the weekend and today (Monday), it had a drop similar to that of the stock markets. It also had a substantial snap-back rally of about 5.7% to close the day at a gain. However, that rebound is not all that special if you look at an intermediate term chart. Important for us is that Cybercurrencies continue to put in lower lows and lower highs – this situation is more pronounced in Bitcoin and Ethereum, etc. than in stocks but, as expected, they do seem to be trending together as we forecasted.
Other indices that we follow that often lead the stock indices in topping and declining like Junk Bonds and High Yield Municipal Bonds (both categories of Mutual Funds that we managed for years) also put in lows today and also had sizeable rebounds BUT their performances were still negative at then end of the day in contrast to those for stocks and Cybercurrencies.
Interest rates of U.S. Treasuries have continued to rise as forecast. Most notable to us is the rise of the Three Month T-Bill (more so than the Six Month Bill, whose yield has risen even more, because people will be able to re-invest more quickly at the now higher yields). From near zero in late May 2020 (0.005%!) to 0.183% today (1/24/2022) – that is a whopping factor of 36x – of course, it was from a near-zero staring point (and it is still near zero); but, that rise is still substantial and very likely is just the beginning of the trend. The rises of the yields of the belly of the curve are amazing! on a percentage basis, if not absolute. Importantly, the Ten Year has now caught up to rest of the curve (except the 30 year which is lagging) in putting in new highest yields since their All-Time lows (all-time high bond prices) of mid 2020. We believe the yield of the 30 year U.S. Treasury will catch up shortly similarly to how the yield of the Ten Year just did. Then, the entire curve will be “breaking out” with yield “higher highs” (bond price “lower lows). Thus, we are forecasting a continued rise in both high quality and low quality (high yield/junk) yields. Remember yields (interest rates) up, means prices of bonds have dropped, which is important when you have all-time record amounts of debt outstanding.
1/5/2021- Many All-Time Tops Holding – The 11/8/2021 (or nearby) All-Time Highs of several of the equity indices (we highlighted previously) have continued to hold; however, slight new All-Time Highs have been achieved by the Dow Jones Industrials, the S&P 500 and the Wilshire 5000. We should have updated our Blog last week that exactly that was likely to happen – that most of the indices were chopping sideways from their initial drops and would likely not make new highs, except for the Dow Industrial and the S&P and the Wilshire 5000 (Float, see below) which had bigger bounces rather than more sideways moves. The Russell 2000 (“RUT”) is probably the best example – chopping sideways from its initial drop and now 10% below its November 8, 2021 All-Time High. The NASDAQ Comp got closer but is now down 6% from its All-Time High. Similar situations are for the S&P 600 Small Caps, the Dow Transports, the Value Line(s), etc. Ok, we’ll keep our call for the All-time Tops for those that did in November 2021 (see below) and call new All-time Tops for the biggies that have just topped or are topping right now. Of course, as always, “we will see,” but to us the upside is minimal and the downside is considerable, unfortunately.
(Note: while the Wilshire 5000, Float weighted, put in its All-Time High in early 2022, the Wilshire 5000, fully market-cap weighted, had its All-Time High back on November 8th, along with the other indices we forecasted, below, and reviewed, above. This difference in the timing of their All-Time Highs because of the different way the indices are calculated shows how minimal the difference really is and how flat the Super Top has become/momentum has slowed (as we have talked about previously) – when a top is this large, it is very flat so much so that a difference in calculation can make a difference in the timing of the ultimate peaks. Of course, the important part is that the rise is over.)
Cyber “Currencies” – The Bitcoin Flash Crash that we highlighted 12/5/2021 did not produce any more real fireworks (yet); however, Bitcoin (and Ethereum) have continued to slide and chop down from those lows. To us their trends are definitely down with “critical support” not far below from where they are right now.
Commodities – We also have gold creeping along, bouncing off support looking like it will crash through. Silver is somewhat similar. Even oil is rising on a shelf that looks like it will break given what we are seeing for interest rates. Thus, financial and industrial commodities look like they are resuming their downward trends – if so, whether they will take out their long time lows of early 2020 is a question.
Interest rates are also rising – bond prices dropping. The belly of the curve – two years up to seven years – have put in the highest yields (lowest prices) since their yield lows of July 2020. The ten year and 30 year yields are right behind them, not at highs for the period, but close to breaking out upwards. The short end yields started up later but have turned upwards similarly. As we continue to point out, that with so much spectacular leverage in the financial system, rising interest rates are very likely to send asset prices plummeting sooner or later. Given what is going on in all of these markets – that time may be right now.
12/5/2021 – Super Top, Super Drop. Following along with our previous comment, Bitcoin dropped almost 26% from Friday’s 12/3/2021 close of approx. $56,845 down to $42,169 on Saturday, before rebounding up to around $48,000. The 26% drop included a straight down “Flash Crash” of over 21% on Saturday (it chopped back and forth down about 5% before the 21% straight down drop). We note from Bitcoin’s All-Time High on 11/9/2021 ($67,802), we referenced in our previous comment, to the recent low it dropped by almost 38%. Now, from that low it has risen back up to a lower high of $49,746, so by almost 18% but it is still down from its All-Time top by 27%. Important for us (and relevant to our previous comments and forecasts) is that Bitcoin put in yet another “lower low”; pretty much confirming the big trend in asset prices is down. And, of course, since then, it has put in another Lower High.
We had read that Bitcoin’s value a few weeks ago was $3 trillion! – that was near its All-Time Top. So, a 27% drop is a decrease in “perceived” wealth of around $810 billion – that is a large amount. We expect that such a contraction in “perceived” wealth will “ripple” throughout the financial system (and possibly into everyday life experiences). In effect, since it is viewed as a “currency,” we expect this contraction will be deflationary; thus, countering the recent inflation we’ve all been experiencing. We think the inflation period of the last couple of years is likely over. We also think the stock and commodity markets and housing, etc. will continue their price drops that we highlighted in our last comment along with the cybercurrencies which seem to be “The Leader” in this down cycle.
We think the rest of this week be “interesting.”
11/28/2021 The string of lower lows and lower highs we highlighted and tracked in our last few writeups were broken to the upside. However, we are now again in that same situation. Importantly, we believe all the fundamentals are still ripe for “The Super Top” and, the fall from it. Ok – similarly to last time, from new All-time tops in Stocks (Dow Industrials, Russel 2000, Dow Transports, etc.) and Bitcoin around 11/8/2021, we have now seen two sets of lower highs and two sets of lower lows; thus, their price trends are now down. This situation is also true with commodities including oil (down to $70 from $85), just not from All-Time highs. So, we now have stocks, cyber “currencies” and commodities all in downtrends. Was that “The Top of The Super Bubble?” Well, while the drops are still small in the scheme of things (except oil, down almost 18%), the moves are still significant and, given all the negative fundamentals and also the “Financial Exuberance” we have highlighted previously, we think it is a very good chance the “The Top of the Super Bubble” is in. Of course, given how irrational this market has behaved over the past several years, “we will see.” Still, as we said before, we think the upside is minimal and the downside is huge. Very interesting times.
10-27-2021 In some ways a lot has happened over the past few weeks; In other ways not much has changed.
EQUITIES – Some of the largest indices broke out of creating “Lower Lows” and “Lower Highs” – The Dow Jones Industrial Average and the S&P 500 put in new, although slight (so far), All-Time highs both inter-day (closing) and intra-day. The NASDAQ 100 put in a new All-Time high intra-day but not inter-day (closing basis) while the NASDAQ Composite itself is still comfortably below both its All-Time highs. Another interesting one is the Dow Jones Transports, which came ever so close but just failed to put in new All-Time highs on either an inter-day (closing basis) and an intra-day basis; thus, I do believe the Dow Theory sell signal is still “ON” although barely. Importantly, most of the other indices we follow and have noted previously (in our analysis below) still have their All-Time highs, “lower highs” and “lower lows,” etc. still intact. Thus, we are pretty much where we were previously (according to our analysis) – still experiencing the types of divergences you see at major tops, etc. However, if we have series of new higher highs and higher lows, it could be off to the races with more irrational All-Time highs. Of course, we will see but the way we see it, the upside is small and downside, in so many asset categories, is huge.
Along with these huge indices struggling to rise, some eking out new highs, we just saw some “Financial Exuberance” of the “Blow Off Top” variety. For, example, Tesla stock rose from $800 up to $1,054 in just over one weeks time! A +31% increase – Yah hoo – that’s on a closing basis – even higher intra-day! Importantly, the move is parabolic – pretty much straight up into the peak, which, if you’ve read us much (our previous analysis and forecasts for parabolic moves and the subsequent price action), we think is likely to be the end of the move (see earlier examples over the years) which turns down (however, the strait up part can last for a while) and ends in a collapse. We would not bet the ranch on a short, but we would not own it either – at these risk levels, this is not “investing.”
To us, these experiences are just more of the same “Finishing Touches” to the Final All-Time Tops (that haven’t already happened, see our previous analysis, below). You typically have such “Financial Exuberance” and “Divergences” between asset categories (and assets in the same categories – see Cyber”Currencies” below) at All-Time highs and we have just seen a few more (see above and below). Also, other super-performing stocks like Amazon and Facebook are below their All-Time highs of a few months ago and look to be in downtrends to us. When the leaders start turning down, it starts to get interesting.
Cyber”Currencies” – First, a comment on articles like “How to best INVEST in Bitcoin” – That makes us chuckle. These are hardly “investments” – they move up and down tremendously and are only “backed” by what someone else is willing to pay for them – they are “Wild Speculations” – Yes, you can make money on them, lots and you can lose lots of money on them to. Along those lines, on 10-20-2021 Bitcoin put in a new All-Time high of almost $66,000, up from $30,000 in July 2021 – not bad. But, since that new All-time high just days ago, it has now dropped below its previous All-time high back in 4-2021 and also below $60,000 so now it is back into a potential downtrend. Now some more “Blow Off Top” exuberance – First, below we did well in calling Doge Coin and Ethereum, neither of which got off their mats during Bitcoin’s latest rise – they are both down substantially from their peaks; again, pointing out that these are not “investments” – Also, note the very large “divergence” in performance within the same category (Cyber”Currencies”). So, now there’s a new CryptoKID on the block – SHIBA – which rose around 600% over the past 30 days! Please refer to our analysis below on Doge Coin as a template for what we think will happen to SHIBA’s value.
Interest Rates – This is an interesting one because the media is pounding the table that interest rates are coming down. But, if you look at the charts, the trend in interest rates/yields is still up. Given the huge amount of press on the current drop in interest rates, we believe the rise in interest rates is set to resume. Given the huge, totally off-the-charts debt levels and financial leverage (we have documented so many times previously), a rise in interest rates certainly could push down prices of the leveraged assets considerably.
10-4-2021 Multiple Sets of “Lower Lows” to be followed by a Big Waterfall drop?
Equities – Since our previous update, most indices have put in nice bounces; importantly, followed by drops back down to just above where those bounces started. From here, we are expecting new sets of lower lows in essentially all equity indices. Also, importantly, at this point, we are looking for those support areas (the lower lows) to be breached with large notable drops that make the downtrends in essentially all equity indices very obvious. Then, followed by a few waterfall drops before putting in notable lows. If this happens, and we think it will, we believe “The TOP” will definitely be in. Of course, those drops will be followed by partial counter-trend rebounds that will retrace just enough (or more) of the drops to entice people to believe we are back in a Bull Market (but, at this point, we are getting ahead of ourselves).
Interest Rates – We look for longer term interest rates to continue their rise upwards, taking out previous recent highs in yields. What we would also like to happen is for the short end to also shift upwards, providing more room for investors to earn a return without taking much risk. Unfortunately, we have yet to see an indication that this shift upwards at the short end has started.
9-30-2021 More Lower Lows join Lower Highs and Establish Downtrends, Very Possibly from “The Top”
Equities – Continuing, as previously, to watch for the “lower lows” to go with the “lower highs” to establish a “downtrend,” today the Dow Jones Industrial Average put in our forecasted lower low on a closing basis but not yet on an intra-day basis. The NASDAQ 100 already had lower lows on each basis but, today, the NASDAQ Composite also joined by adding an intra-day lower low; it had already put in a lower low on a closing basis. The S&P 500 has also added both lower lows: closing basis and intra-day basis.
So, to us, it looks like the finishing touches on “The Top” are being made – and those of the start of “The Downturn” – which we believe could be breathtaking once it gets going.
The Wilshire 5000 Total Market Index put in its all-time high on 9-3-2021 and has also put in a lower low on a closing basis but not on an intra-day basis. It is down only 1.8% from its all-time top; so, if that top holds, we believe we are just in the beginning of “The Downturn.”
An Index that hasn’t put in both lower lows (relative to the recent notable low) is the Dow Jones Transportation Index: but it is approximately just two points above both its intra-day and its closing price. We note this index’s all-time high is earlier on 5-7-2021 versus 8-16-2021 for the Dow Industrials and 9-7-2021 for the NASDAQs and 9-2-2021 the S&P 500.
The Russell 2000 put in its all-time further high back on 3-15-2021 but has failed to put in significant lower lows. It has much further to go down than the Transports to put in lower lows, but we think it will also likely “catch up” shortly to the other indices on the downside. If it does, it should be a larger percentage drop.
9-28-2021 Chronicling Lower Lows, Very Likely Establishing the Trend Down from The Top
So, essentially all stock indices have put in somewhat notable lows on 9-21-2021 from the tops we mentioned previously (below) and then a rebound. They all started down again yesterday and more today; and are close to putting in lower lows (a low, after a rebound, that is lower than the previous low) and lower highs – which makes it a downward trend. In fact, today the NASDAQ put in a lower low on a closing basis, but not on an intra-day basis but the NASDAQ 100 (100 largest high techs) has put in a lower low….on both a closing basis and intra-day basis. So it has a lower high and a lower low and is in a downtrend.
If other indices follow the NASDAQ and put in lower lows, and I think they will, the trend will definitely be down across the board…. this could happen tomorrow – probably this week.
Note – As we have reviewed previously, lots of stock indices peaked starting around February of this year (2021) and subsequently at different times, but the drops have not been very dramatic – until the ones during Late August and September (that we discussed above), which have been followed by the bounce that ended a few days ago. That is how big tops are typically formed: one indice after another peaking….all fanned out over a period of many months to even a year or a bit more – This happened at major tops including the 2000 top, 20006-2007 top, etc. as we have discussed previously, many times over the years.
Also, interest rates of long bonds have resumed their upward paths….similarly to stocks…the move up in
interest rates (down in bond prices) has not been that notable so far, but we expect it will be soon. Of course, as we have discussed so many times previously, with the record debt levels, if interest rates go up notably, all hell will almost certainly break lose with respect to asset price drops.
9-17-2021 Our most recent tax-free performance – You can see we got back ahead for the One Year and ahead for all the other periods, the most important of which are the longer time periods. We will say it has been very difficult to get these types of returns in the current super low yield environment, especially when using such low interest rate risk and credit quality risk. However, we believe our conservative posture will serve our clients well in the future.
Stamper Capital & Investments, Inc.
Separately Managed Accounts (National Tax-Free) vs. Tax-Free Municipal Bond Indices
Annual Total Returns, Period Ended 8-31-2021
| PERIOD | Morningstar Muni Short Category | SCI Separately Managed Tax-Fee Municipal Accounts Composite Net of Fees | SCI Separately Managed Accounts Net Pre-Tax Equivalent* | Bloomberg Barclay’s 3 Year Tax-Free Muni Bond Index |
|---|---|---|---|---|
| 1 Year | 1.27% | 1.58% | 2.44% | 1.17% |
| 3 Years | 2.22% | 2.27% | 3.50% | 2.69% |
| 5 Years | 1.50% | 2.16% | 3.32% | 1.82% |
| 10 Years | 1.42% | 1.94% | 2.99% | 1.65% |
| 15 Years | 2.00% | 2.49% | 3.84% | 2.59% |
| Since Inception (1/1/1995) | N/A | 3.78% | 5.82% | N/A |
Note: Indices do not have fees (trading costs, custody fees, management fees, etc.) deducted from their returns. We now have a much more reasonable index to compare to – the Bloomberg Barclay’s 3 Year Tax-Free Municipal Index. We still aim for similar or better returns with less risk – The key with this table is that our longer term pre-tax municipal bond returns are noticeably higher than the bond market index but with What We Think is less risk – we will see when rates start to rise and/or credit quality yield spreads widen.
Please see the Disclaimer and Footnotes at the bottom of the page for more information.
* at 35% Federal tax rate
8-18-2021 WAS THAT “THE TOP?” In a way, that is a trick question, because the divergences between various sectors has continued. Thus, “The Top” would be in for The Russell 2000 index (“RUT”) of small stocks back on 3-15-2021; since then it has dropped about 8.5%. Similarly for the S&P Small Cap Index (“SML”) which has its all-time-top on 6-8-2021; since then it has dropped about 7%. The Dow Jones Transports (“DJT”) all-time-top is on 5-7-2021; it is down almost 7%. However, the Dow Jones Industrial Average (“DJIA”) just put in a new all-time-peak on 8-16-2021; since then it has had two approximate 300 point down days and is down about 1.8%. Similarly, the S&P 500 also now has its all-time-peak on 8-16-2021 and is also down about 1.8%.
Importantly, this is how major tops generally form – with one investment category group after the other peaking and turning downward. Generally, the more spread out the divergencies, the larger the top. This situation is what we saw at the Tech Top (2000) and even more so at the Housing Bubble Top (2007-2008) before the Financial Crash down into bottoms in 2009 to 2012 depending upon the category. Also importantly, within sectors and indexes like the Dow Jones Industrials, etc. we have seen less and less upside participation by fewer and fewer members – another divergence, an internal divergence of index members, which is also typical of an index or category peaking.
So, that could very well be it for these last indices – “THE TOP” could be in! Yes, given everything we see and have written about, “We think the top IS in,” – for us, certainly a drop here is very likely; however, we wouldn’t recommend anyone betting the ranch (shorting everything) but we do think the the upside potential is minuscule compared to the downside probability. Of course, we will see.
Inflation or Deflation, that is a good question? We discussed or views on this in some detail on 6-11-2021 (below). Since that time gold and silver have continued to drop bolstering our view that any inflation will be short lived and we will still have a huge deflation shortly. Since that time silver dropped almost 18%. What about inflation/deflation on real estate? Well, lumber has fallen another 58% since our we spoke about it on 6-11-2021 (below) as an inflation indicator and indicator of the housing market going forward. In addition, we have seen some articles on people having to move back closer to their work (to work back in the office) and they can’t get bids near where they purchased a year ago – the buyers all lined up and bidding sight unseen have been fading – another indication. Thus, we are watching for confirmation of a whipsaw from inflationary psychology to deflationary psychology – this could be the first inkling.
Interest Rates – Of course, we have records amounts of debt/financing in pretty much all asset categories. After putting in all-time lows in March 2020, the longer rates have been slowly trending/chopping back up. The short end of the curve is still trying to get off the mat (i.e. from near zero) but is up a minuscule amount. We expect these trends to continue and for a pick up in the rate of rise. While rates of the highest quality issuer (U.S. Treasury) could stay down, we expect interest rates of lower quality issuers to rise noticeably with the lowest quality rising the fastest and the most.
Cryptocurrencies – After big drops we forecasted and documented, starting in mid-July 2021, cryptocurrencies like Bitcoin and Dogecoin, etc. put in noticeable PARTIAL counter-trend rebounds (upwards) that probably ended a few days ago. If this sync’s up with a stock market drop, we expect the big downtrend in cryptocurrencies to resume. Of course, this category is very speculative as these “currencies” are only as good as what the next buyer will pay and there is no limit to new issuance of competing cryptocurrencies. However, because of these characteristics and more, we think it is likely a good indicator of investor psychology.
8-13-2021 Our Municipal Bond Investment Performance. We have continued to hang in there for the shorter periods even with the very high levels of cash we have been holding because we have been unable to purchase the quality we want at the yields/prices we want. And, we continue to outperform over the longer periods:
Stamper Capital & Investments, Inc.
Separately Managed Accounts (National Tax-Free) vs. Tax-Free Municipal Bond Indices
Annual Total Returns, Period Ended 7-31-2021
| PERIOD | Morningstar Muni Short Category | SCI Separately Managed Tax-Fee Municipal Accounts Composite Net of Fees | SCI Separately Managed Accounts Net Pre-Tax Equivalent* | Bloomberg Barclay’s 3 Year Tax-Free Muni Bond Index |
|---|---|---|---|---|
| 1 Year | 1.47% | 1.52% | 2.33% | 1.19% |
| 3 Years | 2.25% | 2.22% | 3.50% | 2.69% |
| 5 Years | 1.51% | 2.13% | 3.28% | 1.80% |
| 10 Years | 1.48% | 1.96% | 3.01% | 1.71% |
| 15 Years | 2.05% | 2.51% | 3.86% | 2.64% |
| Since Inception (1/1/1995) | N/A | 3.79% | 5.82% | N/A |
Note: Indices do not have fees (trading costs, custody fees, management fees, etc.) deducted from their returns. We now have a much more reasonable index to compare to – the Bloomberg Barclay’s 3 Year Tax-Free Municipal Index. We still aim for similar or better returns with less risk – The key with this table is that our longer term pre-tax municipal bond returns are noticeably higher than the bond market index but with What We Think is less risk – we will see when rates start to rise and/or credit quality yield spreads widen.
Please see the Disclaimer and Footnotes at the bottom of the page for more information.
* at 35% Federal tax rate
7-15-2021 Picked up a bit of relative performance in the shorter terms even with the large cash percentages. Longer term performance still looks great!:
Stamper Capital & Investments, Inc.
Separately Managed Accounts (National Tax-Free) vs. Tax-Free Municipal Bond Indices
Annual Total Returns, Period Ended 6-30-2021
| PERIOD | Morningstar Muni Short Category | SCI Separately Managed Tax-Fee Municipal Accounts Composite Net of Fees | SCI Separately Managed Accounts Net Pre-Tax Equivalent* | Bloomberg Barclay’s 3 Year Tax-Free Muni Bond Index |
|---|---|---|---|---|
| 1 Year | 1.79% | 1.68% | 2.59% | 1.46% |
| 3 Years | 2.23% | 2.27% | 3.49% | 2.68% |
| 5 Years | 1.48% | 2.17% | 3.34% | 1.79% |
| 10 Years | 1.50% | 1.97% | 3.03% | 1.72% |
| 15 Years | 2.07% | 2.54% | 3.91% | 2.67% |
| Since Inception (1/1/1995) | N/A | 3.80% | 5.84% | N/A |
Note: Indices do not have fees (trading costs, custody fees, management fees, etc.) deducted from their returns. We now have a much more reasonable index to compare to – the Bloomberg Barclay’s 3 Year Tax-Free Municipal Index. We still aim for similar or better returns with less risk – The key with this table is that our longer term pre-tax municipal bond returns are noticeably higher than the bond market index but with What We Think is less risk – we will see when rates start to rise and/or credit quality yield spreads widen.
Please see the Disclaimer and Footnotes at the bottom of the page for more information.
* at 35% Federal tax rat
6-20-2021 Stocks – The Dow Jones Industrial Average has, what we think is a notable double top on 5-7-2021 and 6-4-2021. From there it has recently dropped by 4.2% and has broken a few support levels. As you know, we’ve been looking for the All-Time high for a while and, given the performance in what we are deeming the “leaders of this cycle” – cryptocurrencies, lumber, and other bell weather stocks like Tesla and funds that hold them, like Ark Innovation ETF (ARKK) which has fallen over 35% from its top on 2-25-2021, we believe if we haven’t passed it, we are very close. Thus, to us, for stocks, the upside potential is very poor and the downside probability is huge.
6-15-2021
Below is our current performance. We have continued to lag a bit in the shorter periods but outperform handily in the longer periods. Currently, we’ve held larger portions of cash than desired because we are having difficulty acquiring the quality we want at the prices we want. Thus, we are taking considerably less risk than our peers. We just saw some volatility in the U.S. Treasury market with the short end of the curve rising; we expect this rise to roll over into the municipal bond market so we should have a good relative July 2021. We would not be surprised to see interest rate continue that rise going forward.
Stamper Capital & Investments, Inc.
Separately Managed Accounts (National Tax-Free) vs. Tax-Free Municipal Bond Indices
Annual Total Returns, Period Ended 5-31-2021
| PERIOD | Morningstar Muni Short Category | SCI Separately Managed Tax-Fee Municipal Accounts Composite Net of Fees | SCI Separately Managed Accounts Net Pre-Tax Equivalent* | Bloomberg Barclay’s 3 Year Tax-Free Muni Bond Index |
|---|---|---|---|---|
| 1 Year | 2.24% | 1.64% | 2.52% | 1.64% |
| 3 Years | 2.32% | 2.29% | 3.52% | 2.81% |
| 5 Years | 1.58% | 2.16% | 3.32% | 1.89% |
| 10 Years | 1.51% | 1.99% | 3.06% | 1.76% |
| 15 Years | 2.08% | 2.55% | 3.92% | 2.66% |
| Since Inception (1/1/1995) | N/A | 3.80% | 5.85% | N/A |
Note: Indices do not have fees (trading costs, custody fees, management fees, etc.) deducted from their returns. We now have a much more reasonable index to compare to – the Bloomberg Barclay’s 3 Year Tax-Free Municipal Index. We still aim for similar or better returns with less risk – The key with this table is that our longer term pre-tax municipal bond returns are noticeably higher than the bond market index but with What We Think is less risk – we will see when rates start to rise and/or credit quality yield spreads widen.
Please see the Disclaimer and Footnotes at the bottom of the page for more information.
* at 35% Federal tax rate
6-11-2021 Inflation/Deflation. There is a huge amount of chatter on the possibility of huge inflation going forward. While that is certainly possible, we are not expecting that, at least not now, for a a few reasons. Certainly, we have recently experienced inflation in quite a few categories. Notably, housing and gasoline. We also saw a huge amount of inflation recently in used sporting goods – bicycles, surfboards, hiking gear. We believe the principle reason for the price increases at least in the retail sector was the Stimulus payments, along with rent and mortgage furloughs, utility furloughs, and student loan furloughs, etc (that will have to be unwound in some way at some point in time). That is quite a perfect combination to cause prices to shoot up in certain categories. Of course, if you valued the price of those furloughed assets downward, it could be a “wash” or much worse. Also, we note that gold and sliver prices are still in intermediate term price downtrends. If a true sustainable inflation were coming, we expect that precious metals prices would be putting in a much stronger price performance than they have been making. A possible leader of the inflation/deflation cycle is the price of lumber. It is interesting to us that LUMBER had a parabolic top 5-7-2021, along with the Cryptocurrencies. Since then LUMBER prices have fallen by about 45% – this price drop at the same time as the real estate market has cooled off. In fact, with regards to real estate, rather than people rushing to purchase, most have announced “they’ve been priced out of the [real estate] market.” To us, this is not “inflationary psychology.” In a true inflation, they’d be rushing to purchase now, before it goes up even more. Thus, we believe we are still in a disinflation/deflationary environment with huge price drops, especially in financial assets yet to come. Prices of hard assets and commodities have already declined considerably over the past many years – at some time they will likely decouple their price drops from that of financial asset prices and start upwards. Thus, to us it seems the downside risk of financial asset prices is much more than those of commodity prices but, for now, we think both have downside risk with financial assets having considerably more.
6-10-2021 Cryptocurrencies – The meltdown in the cryptocurrencies has continued and they now have a succession of lower lows and highs. Bitcoin (BTCUST) has now fallen almost 47% from its high on 4-15-2021. Dogecoin (DOGEUSD) has fallen almost 55% from its top on 5-8-2021. Grayscale Ethereum (ETCG) has fallen almost 65% since its top on 5-6-2021. Since these drops, their prices have chopped sideways or their drops have slowed considerably. Given we believe their price trends are down (as detailed considerably earlier), we believe their prices will breakdown out of the recent consolidations. As previously discussed, we expect, unfortunately, the price action in these (and other securities) to be the model for the rest of the risky, over-leveraged financial markets, which most of them are in these times, unfortunately. Thus, to us, the downside price risk of most financial and “currencies” is substantial.
5-14-2021
From our most recent call for The Top of The Mania on 5-10-2021 after several private cyber currencies puked around 40%, big capitalizatin stocks (S&P 500, Dow Jones Industrials, etc.) dropped about 4% last week, before percentage rebound retracements that are typical in a BEAR MARKET. We continue to note (as detailed below) that several equity and equity-like indices including junk taxable bonds and the small cap stocks peaked a month or two ago. Even the NASDAQ peaked back a bit ago on 4-26-21 before the large cryptocurrency drop. We also note that the cryptocurrencies that dropped also experienced fairly large percentage rebound retracements typical of a BEAR MARKET. Still we want to see some more lower lows before we say “the top is definitely in.”
5-13-2021
Below is our recent performance. We have continued to lag in the current one year period because we are holding fairly high levels of cash as it has been very difficult for us to purchase bonds of the downside protection and current yield we are seeking at this point in various investment cycles (that we detail in these pages). We expect that we will outperform going forward. While we believe we have done exceptionally well for the risk taken over the recent shorter year periods, in addition to that, our five year and longer performance far outperforms on an “absolute basis” and even more on a “risk-adjusted basis.”
Stamper Capital & Investments, Inc.
Separately Managed Accounts (National Tax-Free) vs. Tax-Free Municipal Bond Indices
Annual Total Returns, Period Ended 4-30-2021
| PERIOD | Morningstar Muni Short Category | SCI Separately Managed Tax-Fee Municipal Accounts Composite Net of Fees | SCI Separately Managed Accounts Net Pre-Tax Equivalent* | Bloomberg Barclay’s 3 Year Tax-Free Muni Bond Index |
|---|---|---|---|---|
| 1 Year | 3.69% | 1.74% | 2.68% | 3.60% |
| 3 Years | 2.44% | 2.33% | 3.58% | 2.99% |
| 5 Years | 1.60% | 2.16% | 3.32% | 1.87% |
| 10 Years | 1.62% | 1.99% | 3.07% | 1.81% |
| 15 Years | 2.11% | 2.55% | 3.93% | 2.68% |
| Since Inception (1/1/1995) | N/A | 3.81% | 5.86% | N/A |
Note: Indices do not have fees (trading costs, custody fees, management fees, etc.) deducted from their returns. We now have a much more reasonable index to compare to – the Bloomberg Barclay’s 3 Year Tax-Free Municipal Index. We still aim for similar or better returns with less risk – The key with this table is that our longer term pre-tax municipal bond returns are noticeably higher than the bond market index but with What We Think is less risk – we will see when rates start to rise and/or credit quality yield spreads widen.
Please see the Disclaimer and Footnotes at the bottom of the page for more information.
* at 35% Federal tax rate
5-10-2021 “Top of the Mania To You!?!”
Dogecoin USD – Peaked Saturday 5-8-2021, after hours at $0.7387 and collapsed to $0.4245 on early Sunday morning (5-9-2021) before rebounding to $0.5783 a day later on Monday, 5-10-2021. So it fell 42.5% over two days, then rebounded by 36.2%.
Ethereum (Grayscale Ethereum Classic Trust) – Peaked late Thursday 5-6-201 at $95 then plummented to $53.55 on 5-7-2021, Friday Morning. Then rebounded to $64.20 mid-day Monday 5-10-2021 but closed down at $47.55. So this one fell 43.6% over one day and then rebounded 20% the next trading day before its next drop which made the total “Drop from The Top” – down 50%! Wow – that is some action for a “currency!”
Was that the top of this Mania? Very well could be. But, even with those huge drops we do not yet have a lower low. Still, it could be the parabolic rises have been broken. Of course, we will see. Short or Long or on the sidelines, be careful out there! We believe the volatility we are seeing in these private cryptocurrencies could quickly spread over to other markets given the all the information we have documented over the years.
5-9-2021
We have read that “Cryptocurrencies crossed a key threshold in the last week, surpassing the value of all physical US dollars in circulation…“ And, here is the graph:
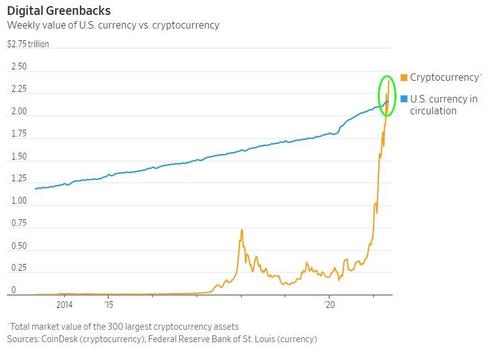
4-25-2021
Market Mania – S&P 500 and Dow Jones Industrial Averages put in slight new highs; however, other indices peaked back in Mid March 2021, including the small caps, Russell 2000, S&P 600 Small Cap Index, etc. Other indices that typically peak before the major stock market indices including junk bonds (“JNK”) and high yield municipal bonds (“HYD”) peaked in Mid February 2021. In addition, Bitcoin fell 15%, a week ago last Sunday (4-18-2021); todady (4-25-2021) it (BTCUSD) is at $47,934, down 24% from its $63,381 all time top on 3-15-2021. Also, Dogecoin (another private block chain “currency” – hmmm, there is no limit to the supply of these private “currencies” as there are no barriers to entry, currently) which had risen 18,000% from around a year ago (not that difficult to get such huge percentage when you start at essentially zero) has dropped about 40% since 4-19-2021 – in over just six days! (Note: we are not an expert on these coin securities as they are brand new and may or may not be reported correctly nor correlate with the underling “currency”- but we think what we have reported is accurate.)
Given the incredible action in the Block Chain based currencies including their huge percentage-increase parabolic rises that we documented above and have documented previously, we believe we – not just the U.S., but most of the world World, is in a HUGE MANIA even bigger than 1630’s Tulip Mania when a single Tulip bulb sold for more than a house before dramatically collapsing in prices in February 1637. – At least you can plant a tulip bulb. Confirmation of the Mania is that it seems to exist in other areas of society besides private “currencies” – We seem to be in very crazy times.
Given the recent, large drops in prices of Bitcoin and Dogecoin (detailed above), it appears to us that their large, near vertical parabolic rises have just been broken. If this is correct, expect the fall in their prices to continue all the way down to “true value” (remember, there are no barriers to entry with private block chain currencies (government currencies are a different matter)). The size of this market of private (non-government) block chain “currencies” or “E-coins” is now huge, in part because there are so many but, mostly, because their prices have gone up so much (“on the margin” – remember, when there is a trade at a price, all of that coins of that issue (Bitcoin, Doge or whatever) are valued at that same price).
We just found a webside: https://coinmarketcap.com/all/views/all/ that lists over 400 “E-coins,” their market capitalizations, etc. We do not know if their data is reliable. They give the market cap of Bitcoin at $893,435,303,805 – wow – that is huge! That is the largest one – but, there are at least 400 more smaller ones listed. Thus, there is plenty of “money” (or however you want to categorize it – say “wealth” or, probably more accurately, “perceived wealth”) to evaporate (even faster than it was created) and, then, to implode other markets in a huge ripple, unfortunately.
We believe this Mania has spilled over into other markets. It is kind of the euphoria that we’ve seen at other markets tops (the 2000 Tech Top, the 2006-2007 Housing Bubble Top, etc.) but on steroids. Valuation separates from reality, enhanced by a “suspension of disbelief” by enough market participants (enthusiasts) to dramatically overcome the skeptics, for a while – sometimes a long while. It is typically reflected the most in one market – usually the one with the shortest track record & the least understanding – like private block chain currencies! (or tulip bulbs, or electric companies when they were brand new). When it cracks, likely all other markets that were overvalued (in a mania or in bubbles) will follow along with it, down to notable bottoms. Unfortunately, that scenario fits with most of all the information and opinion we have published in these pages.
4-11-2021
Interest rates of shorter municipal bonds dropped (prices rose) and a poor performing month dropped off the current twelve month performance, resulting in a large total return for the category for the current twelve months ending 3-31-2021. Our performance lagged the current twelve months as we held substantial amounts of cash as we were unable to buy the defensive bonds we were seeking and we had outperformed during the month that dropped off. However, as you can see in the chart we continue to outperform for all longer periods, especially when adjusted for risk.
Stamper Capital & Investments, Inc.
Separately Managed Accounts (National Tax-Free) vs. Tax-Free Municipal Bond Indices
Annual Total Returns, Period Ended 3-31-2021
| PERIOD | Morningstar Muni Short Category | SCI Separately Managed Tax-Fee Municipal Accounts Composite Net of Fees | SCI Separately Managed Accounts Net Pre-Tax Equivalent* | Bloomberg Barclay’s 3 Year Tax-Free Muni Bond Index |
|---|---|---|---|---|
| 1 Year | 3.06% | 1.81% | 2.78% | 3.50% |
| 3 Years | 2.26% | 2.36% | 3.63% | 2.81% |
| 5 Years | 1.56% | 2.16% | 3.32% | 1.88% |
| 10 Years | 1.61% | 2.00% | 3.08% | 1.84% |
| 15 Years | 2.07% | 2.56% | 3.94% | 2.67% |
| Since Inception (1/1/1995) | N/A | 3.82% | 5.87% | N/A |
Note: Indices do not have fees (trading costs, custody fees, management fees, etc.) deducted from their returns. We now have a much more reasonable index to compare to – the Bloomberg Barclay’s 3 Year Tax-Free Municipal Index. We still aim for similar or better returns with less risk – The key with this table is that our longer term pre-tax municipal bond returns are noticeably higher than the bond market index but with What We Think is less risk – we will see when rates start to rise and/or credit quality yield spreads widen.
Please see the Disclaimer and Footnotes at the bottom of the page for more information.
* at 35% Federal tax rate
3-10-2021
Interest rates increased the speed of their rise last month as we discussed in our 2-26-2021 Commentary, below. Accordingly, our performance increased its lead over the Morningstar Short Muncipal Bond Fund category Average over most periods as shown in the table below. Note our increase was principally due to having less interest rate risk.
Stamper Capital & Investments, Inc.
Separately Managed Accounts (National Tax-Free) vs. Tax-Free Municipal Bond Indices
Annual Total Returns, Period Ended 2-28-2021
| PERIOD | Morningstar Muni Short Category | SCI Separately Managed Tax-Fee Municipal Accounts Composite Net of Fees | SCI Separately Managed Accounts Net Pre-Tax Equivalent* | Bloomberg Barclay’s 3 Year Tax-Free Muni Bond Index |
|---|---|---|---|---|
| 1 Year | 1.16% | 1.99% | 3.07% | 1.80% |
| 3 Years | 2.18% | 2.41% | 3.71% | 2.69% |
| 5 Years | 1.51% | 2.17% | 3.34% | 1.77% |
| 10 Years | 1.61% | 2.03% | 3.12% | 1.85% |
| 15 Years | 2.05% | 2.61% | 4.02% | 2.64% |
| Since Inception (1/1/1995) | N/A | 3.83% | 5.89% | N/A |
Note: Indices do not have fees (trading costs, custody fees, management fees, etc.) deducted from their returns. We now have a much more reasonable index to compare to – the Bloomberg Barclay’s 3 Year Tax-Free Municipal Index. We still aim for similar or better returns with less risk – The key with this table is that our longer term pre-tax municipal bond returns are noticeably higher than the bond market index but with What We Think is less risk – we will see when rates start to rise and/or credit quality yield spreads widen.
Please see the Disclaimer and Footnotes at the bottom of the page for more information.
* at 35% Federal tax rate
2-26-2021
Interest rates rose since our last report, as we expected. The yield on the U.S. Thirty Year rose notably from 1.91% on 2-10-21 by 39 basis points up to a 2.30% on 2-25-201 – that is a 20% rise in yields! The Ten Year all the way down to the Three Year rose similarly. And, the markets finally took note, probably, in addition to the size of the move, because prices (prices down when yields go up) dropped to sitting on “critical support” according to the technical types; thus, most of them are very nervous now, which, makes it likely we will get a bit of a rebound in prices (down in yield) before the main trend (up in yields) resumes.
That sharp rise in yields is attributed to causing the Dow Jones Industrial to drop about 1,000 points – given the huge level it dropped from, the amount of the drop, and the form of the drop (among other factors), we can make the case that the top is “in;” however, given how irrational the markets are – at such high levels when the economy had dropped so much, “don’t bet the ranch.” Still, given the continuing trend in interest rates in such a highly leveraged enviornment, we think it is highly probable that the top is here (somewhere, if not just passed).
Bitcoin also rose to put in a “Notable High” (see our 2021 Annual Forecast) of around $59,000 on 2-21-2020 before dropping down to around $45,000 on 2-26-2021 – a drop of almost 24% in just a few days! (how is that volatility for a “currency”!?). This drop also attributed to the recent rise in interest rates (which will probably be just a blip, although the start of the ramp up in yields (down in prices), in the long term scheme of things).
Inflation and gold. Many are expecting a large to huge inflation and even runaway inflation because of their speculations about increases in the money supply and also increased fiscal stimulus. However, price action in gold (and sliver) we have been forecasting is giving a different signal. Also attributed to the recent rise in interest rates, the price of gold continued its decline (that started on 8-6-2020 at $2,069) from $1,842 on 2-20-2021 down $114 to $1,728 on 2-26-2021 – that recent continuation is a drop of over 6%. So there is a difference of opinion on future inflation between the gold market and what many pundits are saying. We expect debt to default quicker than money is printed and bailouts are passed. This situation would be similar to that of the Financial Crash (2006 down into 2009) but likley larger from higher levels – both prices and debt levels, unfortunately.
2-12-2021
Here is our current performance. Please note we have been postured very conservatively with respect to rising interest rates and declining credit quality.
Stamper Capital & Investments, Inc.
Separately Managed Accounts (National Tax-Free) vs. Tax-Free Municipal Bond Indices
Annual Total Returns, Period Ended 1-31-2021
| PERIOD | Morningstar Muni Short Category | SCI Separately Managed Tax-Fee Municipal Accounts Composite Net of Fees | SCI Separately Managed Accounts Net Pre-Tax Equivalent* | Bloomberg Barclay’s 3 Year Tax-Free Muni Bond Index |
|---|---|---|---|---|
| 1 Year | 1.99% | 2.06% | 3.17% | 2.54% |
| 3 Years | 2.32% | 2.41% | 3.70% | 2.83% |
| 5 Years | 1.64% | 2.16% | 3.33% | 1.92% |
| 10 Years | 1.71% | 2.04% | 3.13% | 1.92% |
| 15 Years | 2.10% | 2.64% | 4.07% | 2.67% |
| Since Inception (1/1/1995) | N/A | 3.83% | 5.89% | N/A |
Note: Indices do not have fees (trading costs, custody fees, management fees, etc.) deducted from their returns. We now have a much more reasonable index to compare to – the Bloomberg Barclay’s 3 Year Tax-Free Municipal Index. We still aim for similar or better returns with less risk – The key with this table is that our longer term pre-tax municipal bond returns are noticeably higher than the bond market index but with What We Think is less risk – we will see when rates start to rise and/or credit quality yield spreads widen.
Please see the Disclaimer and Footnotes at the bottom of the page for more information.
* at 35% Federal tax rate
2-12-2021
Markets have continued in their choppy ever so slightly rising upward slants at incredibly high valuation levels, even in the face of the incredibly increased RISKS of these times in addition to all the stuff we have documented over the last few years. They have even rebounded enough to erase the huge drop into March 2020 related to the Corona Virus, etc. Even with record levels of debt climbing ever higher in almost all issuing categories. Mortgage payments and rent payments being further furloughed making the current debts ultimately even higher & higher, for example. The lack of rationality in the markets is appalling but, you can sell at those prices — there are buyers.
I can (and have in these pages) document all kinds of fundamentals that show vast over-valuation in essentially all investment categories. However, in markets this irrational that knowledge does not help much, at least not in the short term (or, in the case of the last several years, the intermediate term). We think we are in one Overall Super Bubble. Given regular “Fundamental Analysis” and even our Upside Potential/Downside Protection(/Current Yield) analysis and investment style doesn’t really help a lot right here, other than to be very conservatively postured – as we say at times, “Give up some upside potential to pick up a more than proportionate amount of downside protection” & we usually continue “& current yield” but right now the yields are so low. However, we have other methods of looking at these markets.
Interest Rates – Interest rates have continued to chop up to new rebound highs. The U.S. 30 Year yield which had an All-Time yield bottom on 3-9-2020 at 1.02% moved up to 1.88% on 1-11-2021. Even though still an absolute low interest rate (1.88%), that rise is almost 90%! The U.S. 10 Year is in a similar configuration. It put in its All-Time low yield on 8-4-20 at 0.508%. It chopped up to its rebound yield high of 1.145% on 1-11-2021, a rise of 125%. Again, a considerable rise but still at an absolute low yield level. Still, these yield rises have dropped the corresponding bond prices notably. The recent yield rises almost look like breakouts, to the upside. If (and when) yields shoot up more, it will take a toll on pretty much all asset prices as in this Super Bubble, pretty much all assets are heavily leveraged, unfortunately.
Importantly, The Dow Jones Industrial Average put in a new, ever so slight, All-Time Market top on Thursday 1-14-2021. Other indices had either peaked earlier and/or did not quite put in new All-time Market tops but they are all close if not there. But, Importantly, the next day, on Friday, we see the possible beginning of “The Decline from the Tops.” Every Equity indice that we looked at has that appearance to us – that of starting significant potential declines (some starting before 1-14-2021). We believe these declines could be the start of something big, even huge. We also have a huge, steep parabolic rise in BitCoin (and other E-coins); however, it looks like that steep parabolic rise has been broken (either way, we think this is a casino market – not “investing,” and certainly not “currency” or “money” at least not at this juncture). Of course, we will see but that very well could be the end of this incredible move up in asset prices from the Financial Crash lows (2009 to 20012, depending upon the category).
1-17-2021
Although we have continued to do very well on a longer term basis, both in absolute terms (below) and on a risk-adjusted basis (since the risk we think we are taking is very low), we have lagged a bit on for the current one year absolute performance (see chart below) as we have been upwards of 40% in cash over the last several months because we have not been able to purchase the extra safe bonds we want at the prices we are bidding. However, for the longer periods you can see we easily beat the index and that is even with a much lower risk profile.
Over the past 31 years of professionally managing 4 mutual funds in three different bond fund categories and these private accounts since 1995, we have often had difficulties staying invested near market tops, especially, if we are trying to position in what turns out to be the best way. So, with our extra conservative posture right now, we would not be surprised to see a turn up in rates and an increase in concern for lower quality credits.
Stamper Capital & Investments, Inc.
Separately Managed Accounts (National Tax-Free) vs. Tax-Free Municipal Bond Indices
Annual Total Returns, Period Ended 12-31-2020
| PERIOD | Morningstar Muni Short Category | SCI Separately Managed Tax-Fee Municipal Accounts Composite Net of Fees | SCI Separately Managed Accounts Net Pre-Tax Equivalent* | Bloomberg Barclay’s 3 Year Tax-Free Muni Bond Index |
|---|---|---|---|---|
| 1 Year | 2.27% | 1.99% | 3.07% | 2.96% |
| 3 Years | 2.21% | 2.40% | 3.70% | 2.80% |
| 5 Years | 1.67% | 2.17% | 3.34% | 2.00% |
| 10 Years | 1.66% | 2.03% | 3.13% | 1.90% |
| 15 Years | 2.10% | 2.65% | 4.08% | 2.67% |
| Since Inception (1/1/1995) | N/A | 3.84% | 5.90% | N/A |
Note: Indices do not have fees (trading costs, custody fees, management fees, etc.) deducted from their returns. We now have a much more reasonable index to compare to – the Bloomberg Barclay’s 3 Year Tax-Free Municipal Index. We still aim for similar or better returns with less risk – The key with this table is that our longer term pre-tax municipal bond returns are noticeably higher than the bond market index but with What We Think is less risk – we will see when rates start to rise and/or credit quality yield spreads widen.
Please see the Disclaimer and Footnotes at the bottom of the page for more information.
* at 35% Federal tax rate
12-21-2020
The net for most asset prices from last month was a lot of choppy, slightly upwards price movements, some to ALL-TIME Highs but not by much, a few days ago.
Today was the Winter Solstice (shortest day of the year) and, also, quite possibly much more importantly, the tightest conjunction of Jupiter and Saturn in around 796 years but, this time, the first in modern history in Aquarius. Jupiter and Saturn moved into Aquarius staggered a few days ago.
Stocks put in a small top a few days ago. Obviously, all our concerns about lack of downside protection and huge amounts of downside potential are as strong as ever and even stronger given new All-Time Highs in some indices. We would not be surprised to see a noteable acceleration down in price in stocks and bonds (up in yields), especially lower quality and longer term bonds. Yup that is speculative; however, at these levels, our opinion is that peope are not “investing,” they are “speculating,” likely wildly. Of course, we will see.
11-15-2020
As we forecasted last month, we did experience quite a lot of fireworks in the markets just before and after the election. As some things still are not resolved, we are expecting more fireworks to come.
Just after the election, some stocks and indices broke upward very sharply but then turned around and, before the close, plummeted in notable partial retracements of their rises. At this time some of those sharp inter-day peaks have not been eclipsed; however, over the past few days some of the indices have run up yet again to new All-Time Highs! Numerous inter-market divergences continue to indicate a huge topping process in progress as we’ve talked about too many times. Thus, we are still waiting for some remaining Final All-time Highs & it could be a while; however, when it happens, at this point, we believe the turn down will be swift and notable. Given all the data we’ve gone over so many times before, we believe the upside is severely limited while the downside potential is huge, unfortunately.
Gold – As stocks were shooting up in their temporary ascent, gold dropped almost $100 per ounce – a huge move and, importantly, has not rebounded notably since that drop. This drop makes the trend of gold downward more likely. It also put a hole in most “Inflation Theories.” Silver has performed similarly.
Bonds – Interest rates of the most intermediate U.S. Government Treasuries have continued to drift upwards, putting in higher highs and lower lows of yields. In fact, they’ve gone up enough, in most cases, to be declared “breakouts,” although, slight. As we have reviewed numerous times, we expect that the All-Time lows in interest rates are in our past. We expect the rises in interest rates to begin to accelerate. If and when they do, those with high debt levels, which includes most everyone these days, from individuals to companies to municipalities, etc. will very likely be in trouble as their debt service loads increase while asset values fall, unfortunately.
Credit Quailty & Yield Spreads – The effects of the shutdowns of the economy are continuing with many unfortunte consquences likely to surface more strongly. There will likely be huge negative consequences for landlords, renters, mortgagees & mortgagors and tax payment recipients that will result in defaults, unfortunately. This situation should first result in credit quality yield spreads blowing out from their ridiculously tight levels to probably, eventually, record wide levels given how widespread these problems are, unfortnately. Then, the official defaults. However, in the Financial Crash (2007-2009) we often saw downgrades from Investment Grade directly to default with no intermediate downgrade steps by the rating agencies. So far, almost the entire market has held up so, at this time, we expect a shockingly swift turn of events, unfortunately.
11-15-2020
We are continuing to do well compared to the pack even with the very high levels of cash we have been carrying and the market not going down substantially (yet). We continue to have difficulty finding the bonds that we want at the prices we would like to purchase at. Still, look how well we have continued to perform! When or if the market trades off, whether just due to rising interest rates (or credit quality yield spreads blowing out, as we expect they will), we think we will definitely outperform as we usually do in more hostile environments.
Stamper Capital & Investments, Inc.
Separately Managed Accounts (National Tax-Free) vs. Tax-Free Municipal Bond Indices
Annual Total Returns, Period Ended 10-31-2020
| PERIOD | Morningstar Muni Short Category | SCI Separately Managed Tax-Fee Municipal Accounts Composite Net of Fees | SCI Separately Managed Accounts Net Pre-Tax Equivalent* | Bloomberg Barclay’s 3 Year Tax-Free Muni Bond Index |
|---|---|---|---|---|
| 1 Year | 1.98% | 1.99% | 3.05% | 2.90% |
| 3 Years | 1.88% | 2.44% | 3.75% | 2.37% |
| 5 Years | 1.55% | 2.18% | 3.35% | 1.85% |
| 10 Years | 1.77% | 1.98% | 3.04% | 1.77% |
| 15 Years | 2.09% | 2.68% | 4.13% | 2.66% |
| Since Inception (1/1/1995) | N/A | 3.85% | 5.93% | N/A |
Note: Indices do not have fees (trading costs, custody fees, management fees, etc.) deducted from their returns. We now have a much more reasonable index to compare to – the Bloomberg Barclay’s 3 Year Tax-Free Municipal Index. We still aim for similar or better returns with less risk – The key with this table is that our longer term pre-tax municipal bond returns are noticeably higher than the bond market index but with What We Think is less risk – we will see when rates start to rise and/or credit quality yield spreads widen.
Please see the Disclaimer and Footnotes at the bottom of the page for more information.
* at 35% Federal tax rate
10-18-2020
The 9-2-2020 equity market tops that we speculated would be “All-Time”…”for those that hadn’t already topped (up to years ago)” during the Great Divergence have held for essentially all indices and most stocks. There have also been a lot of shorter term divergences above recent highs, but not “All-Time Highs,” for several indices that saw there “All-Time Highs” months to years before the 9-2-2020 “All-Time Highs” of other indices. The S&P 600 Small Cap Index as compared to the Dow Jones Industrial Average, for example.
Interest rates – Nothing much as changed since our previous updates. The previous All-Time Lows of the U.S. Treasury 10 year and 30 year are still intact with rates drifting slightly upwards with slightly higher highs and lower lows. Shorter term rates have been scraping sideways, somewhat above their lows, of May or July 2020 depending upon the duration.
We have “The Election” coming up, which could be accompanied by some wild market fireworks. Of course, we will see.
10-14-2020
We are still doing well in the short run (One Year Performance); although we have dropped a bit. We have been having a difficult time buying what we are seeking, and, accordingly, have been carrying much higher levels of cash. Thus, our risk downside risk level is even lower than normal. Of course, if rates rise, the extra defensive posture will help us outperform in a negative market even more than normal, we do believe.
Over the long run we continue look very good – Have a look at the table below.
Stamper Capital & Investments, Inc.
Separately Managed Accounts (National Tax-Free) vs. Tax-Free Municipal Bond Indices
Annual Total Returns, Period Ended 9-30-2020
| PERIOD | Morningstar Muni Short Category | SCI Separately Managed Tax-Fee Municipal Accounts Composite Net of Fees | SCI Separately Managed Accounts Net Pre-Tax Equivalent* | Bloomberg Barclay’s 3 Year Tax-Free Muni Bond Index |
|---|---|---|---|---|
| 1 Year | 2.19% | 2.09% | 3.21% | 3.53% |
| 3 Years | 1.91% | 2.44% | 3.75% | 2.42% |
| 5 Years | 1.59% | 2.19% | 3.37% | 1.93% |
| 10 Years | 1.46% | 1.98% | 3.05% | 1.80% |
| 15 Years | 2.08% | 2.71% | 4.15% | 2.67% |
| Since Inception (1/1/1995) | N/A | 3.86% | 5.94% | N/A |
Note: Indices do not have fees (trading costs, custody fees, management fees, etc.) deducted from their returns. We now have a much more reasonable index to compare to – the Bloomberg Barclay’s 3 Year Tax-Free Municipal Index. We still aim for similar or better returns with less risk – The key with this table is that our longer term pre-tax municipal bond returns are noticeably higher than the bond market index but with What We Think is less risk – we will see when rates start to rise and/or credit quality yield spreads widen.
Please see the Disclaimer and Footnotes at the bottom of the page for more information.
* at 35% Federal tax rate
9-20-2020
The likely Final Tops of the equities and indices that hadn’t already topped (over the past several years, as we have outlined, below), that we speculated would occur soon, likely happened on 9-2-2020. On 8-27-2020 we “speculate[d] that we [were] directly in the neighborhood of ‘The Equity Market Top’ (at least for those stocks and indicies at or near All-Time Highs)”…that hadn’t already topped.
Since 9-2-2020 we’ve seen fairly large drops in almost all equities and, importantly, of those few Indicies and equities that posted their All-Time-Highs (see 8-27-2020, below). Since those initial drops, we’ve seen a choppy sideways rebound shelf constructed. We believe prices will drop through that shelf. If they do, then we will have a set of lower lows and that will make this “call of the top” more solid. Next, we would need a lower high to confirm the trend is down. However, if the drops are very large, as we believe they could be, we believe “the tops will be in.”
Interest Rates – Since our last Market Comment, interest rates of the U.S. 10 and 30 year Treasuries have drifted up, leaving our previous comments (about an imminent rise in interest rates) intact.
Of course, we will see.
8-27-2020
Tippity Tippity Top(s)? Based on the analysis below we are going to go out on a limb and speculate that we are directly in the neighborhood of “The Equity Market Top” (at least for those stocks and indices at or near All-Time-Highs). If this is so, prices of essentially all assets will be falling along with them.
In our last update we were talking about major divergences. We want to add two major divergences versus the current All-Time-Highs in the NASDAQ and the S&P500 (that happened today).
One is the stock prices of the U.S. banks. We have talked many times over the years about the KBW Bank Index. However, we were asleep at the switch this time; but we have it now. The KBW Bank Index put in its All-Time-High in June 2018 followed by a sizeable drop into December 2018. From there it had a choppy rally to its next (lower) peak in December 2019, followed by another sizeable drop to late March 2020 (with the rest of the market). From there it has rebounded to a lower peak at the end of May 2020 (thus it has a series of lower lows and lower highs from its All-Time-Top) and started dropping down again (while the NASDAQ and the S&P 500 were/are putting in new All-Time-Highs).
Another equity investment category with a major divergence (however not over as long a time period) are the Utility stocks. Note that utilities are affected some what by the bond market (like bank stocks talked about above). The Dow Jones Utility Index’s spiked up to its All-Time-High on 2-18-2020, followed by a major drop down into mid/late March 2020. Since then it put in a couple of lower highs the highest (and also the most recent ) was on 6-8-2020, and another one almost as high on 8-10-2020 (again, a series of lower lows and lower highs since its All-Time-High) – since then it is down while the NASDAQ and S&P 500 put in there latest All-Time-Highs.
Yields (interest rates) breaking up – over the past two days Yields of most U.S. Treasuries have broken up above their previous highs. We have been trying to call the bottom of interest rates for quite a while. We note that the yield of the U.S. Treasury 30 year’s All-Time-Bottom was on 3-9-2020 at 1.02%!!!! (wow is that low); the Treasury 10 year’s All-Time-Low was later, just a few weeks ago on 8-6-2020 at only 0.54%. However, for us besides these extremely low levels, since those lows higher highs have given way to new higher highs. So, for us, the trend in yields is upwards. This is the case almost entirely across the U.S. Treasury yield curve. Importantly, because the yields are so low, it won’t take but small basis point rise in these yields to really push down bond prices. And, as we’ve pointed out so many times over the years, almost all assets these days are heavily financed from real estate to stocks to commodities. So if we do have a large (relative) rise in interest rates, that should push down asset pries. Unfortunately, downside potential from the lofty asset price levels is substantial even with a somewhat small rise in interest rates (because they are so incredibly low to start with).
August 16, 2020
Market Comment – The huge market Divergences that we have been writing about (and that essentially always accompany major market tops) are continuing (but a couple may have already morphed into a “change of trend”).
A great example is oil which we talk about at the top of this page. Below is the long term graph. While its current price is $42.01 (not reflected in the chart), the important concept is that its price is far far below its all time high back in 2008 and is below many highs since then, including the most recent one at the beginning of 2020 as shown in the chart. Its trend is clearly down over numerous long and intermediate time periods:
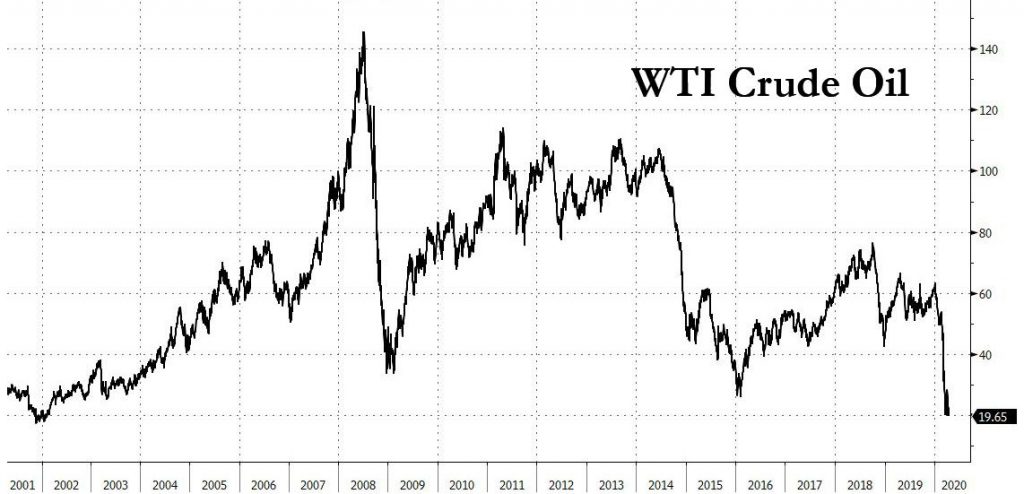
At the same time, we have a Record high in the NASDAQ, near record high in essentially all bond categories (interest rates down, bond prices up) including Treasuries, Corporates, High Yield Junk bonds, and Municipal bonds. Besides the huge divergences in the price of oil versus these other categories, we also have large divergences within those categories. Stocks for example, had the all time high in the NASDAQ but the small caps are lagging and are noticeably below their all-time highs.
Another major divergence within those markets is that while some equity indices are at record highs, essentially all stocks are not. How can this be? It is because this last drive up has been essentially driven by less than 8 stocks (as we outlined previously). So another major divergence is between those “special” stocks and the rest of the equity market. Astounding, but typical at major market tops!
Another major divergence from the price of oil is the price of another commodity, gold, which just eked out a new all-time high. Yet another major divergence related to that is the price of gold versus the price of silver, which is far below its all-time high.
(An Aside: Interestingly, everyone (well, most everyone) is obsessed with inflation due to the actions of the Federal Reserve (a subject we reviewed in more detail previously); however, major commodities, oil and silver, have prices substantially or noticeably below new highs. Also, interest rates are near record lows. Back when inflation was raging in the late 1970’s, you may remember, interest rates were around 17% not 1.71% like the U.S. Treasury Long Bond is currently. Of course, we make this point, in part, because it helps our case that we are going to experience a definite deflation. In addition, as we have discussed numerous times in these pages, we expect interest rates to shoot up, pushing prices of all heavily financed assets (which is essentially all assets) downwards substantially. While we have been searching for the bottom in interest rates for some time, it may be that we just passed it a week ago for the U.S. Ten Year Treasury yield and over five months ago for the U.S. Thirty Year Treasury yield – another divergence! and a possilbe “change in trend.”)
The divergence of gold prices versus silver prices is probably an excellent “real time” example because it has likely been followed by a change in trends! Not only did their fortunes diverge, with gold just eking out a new all-time new high and silver not being close to its all-time high (although both heading up strongly), but, importantly, they both just experienced substantial price drops. So, this may be an good example (if the new trend continues) of how a major divergence (one at a record high but not true for another similar category) turns into a “change in trend;” in this case downward; thus, marking a significant top. We expect to eventually see this behavior in all market categories.
Stamper Capital & Investments, Inc.
Separately Managed Accounts (National Tax-Free) vs. Tax-Free Municipal Bond Indices
Annual Total Returns, Period Ended 7-31-2020
| PERIOD | Morningstar Muni Short Category | SCI Separately Managed Tax-Fee Municipal Accounts Composite Net of Fees | SCI Separately Managed Accounts Net Pre-Tax Equivalent* | Bloomberg Barclay’s 3 Year Tax-Free Muni Bond Index |
|---|---|---|---|---|
| 1 Year | 2.14% | 2.27% | 3.49% | 3.15% |
| 3 Years | 1.92% | 2.44% | 3.76% | 2.41% |
| 5 Years | 1.61% | 2.18% | 3.36% | 2.00% |
| 10 Years | 1.50% | 1.98% | 3.05% | 1.80% |
| 15 Years | 2.11% | 2.71% | 4.18% | 2.69% |
| Since Inception (1/1/1995) | N/A | 3.87% | 5.96% | N/A |
Note: Indices do not have fees (trading costs, custody fees, management fees, etc.) deducted from their returns. We now have a much more reasonable index to compare to – the Bloomberg Barclay’s 3 Year Tax-Free Municipal Index. We still aim for similar or better returns with less risk – The key with this table is that our longer term pre-tax municipal bond returns are noticeably higher than the bond market index but with What We Think is less risk – we will see when rates start to rise and/or credit quality yield spreads widen.
Please see the Disclaimer and Footnotes at the bottom of the page for more information.
* at 35% Federal tax rate
July 20, 2020
Market Comment – Although it may not feel like it (as we will explain below), almost all stocks and stock indices continue to trade below their June 8, 2020 highs (or earlier in the case of the small cap stocks and small cap indicies like the Russell 2000 and S&P 600 Small Cap Index). The reason why is that the NASDAQ Composite and the NASDAQ 100 have zoomed back up to New All-Time Highs – and that is what the media attends to. In fact, almost all the up volume and price action is in just 7 stocks. I’m sure you’ve heard of them – we’ve highlighted most of them before: Apple, Google (Alphabet), Microsoft, Netflix, Amazon, Facebook and Tesla. A subset of these are called the FAANG stocks. We have also characterized the Bubble these stocks have caused the “E-Commmerce Bubble” which we think is more useful than the “All Everything Bubble” which some analysts call our current predicament.
The key is the huge divergence between the early All-time Toppers (small caps, etc.) and the Later Toppers (Dow Jones Industrial Average and the S&P500, etc.) and the E-Commerce Bubblers (NASDAQ, more specifically the seven stocks we mentioned above) is very typical behavior of a major market top – as we have explained so many times before – back at the 2000 top before the “Tech Wreck,” back at the Housing Bubble Top before the “Financial Crash” into 2009/2010, and now (well, over the past couple of years). Accordingly, all our previous forecasts stand. Also, importantly, we don’t think it is just stocks putting in a major top, but also Bonds – geeze, in many ways the Bond top is even more spectacular, which, unfortunately, means their crash (interest rates zooming up) will also be spectacular. We also believe commodities will resume their bear markets.
Stamper Capital & Investments, Inc.
Separately Managed Accounts (National Tax-Free) vs. Tax-Free Municipal Bond Indices
Annual Total Returns, Period Ended 6-30-2020
| PERIOD | Morningstar Muni Short Category | SCI Separately Managed Tax-Fee Municipal Accounts Composite Net of Fees | SCI Separately Managed Accounts Net Pre-Tax Equivalent* | Bloomberg Barclay’s 3 Year Tax-Free Muni Bond Index |
|---|---|---|---|---|
| 1 Year | 1.95% | 2.36% | 3.62% | 3.11% |
| 3 Years | 1.82% | 2.46% | 3.79% | 2.36% |
| 5 Years | 1.52% | 2.19% | 3.36% | 1.96% |
| 10 Years | 1.51% | 2.02% | 3.11% | 1.83% |
| 15 Years | 2.05% | 2.72% | 4.18% | 2.63% |
| Since Inception (1/1/1995) | N/A | 3.88% | 5.97% | N/A |
Note: Indices do not have fees (trading costs, custody fees, management fees, etc.) deducted from their returns. We now have a much more reasonable index to compare to – the Bloomberg Barclay’s 3 Year Tax-Free Municipal Index. We still aim for similar or better returns with less risk – The key with this table is that our longer term pre-tax municipal bond returns are noticeably higher than the bond market index but with What We Think is less risk – we will see when rates start to rise and/or credit quality yield spreads widen.
Please see the Disclaimer and Footnotes at the bottom of the page for more information.
* at 35% Federal tax rate
June 14, 2020
Market Comment – We note the decline in stocks we forecasted on June 8th 2020 (in these pages) has very likely begun. Last week we had one day where the Dow Jones Industrials was down Nealy 7%. If this trend continues and we think it will, we expect a replay of the huge declines experienced earlier in the year in all the same categories but this time we think the drops will, unfortunately, be larger. Of course, we will see – nothing is certain in “investing” or “speculating” which is what most of it is when your are at such extremely high price levels (and low yields) and with such huge amounts of debt financing pretty much everything. We ask, what could go wrong? Be careful out there – which likely means, take some risk off the table.
Our short term Municipal Bond Account Performance – We are still doing well, because we never dropped much in price. However, you can see the M.S. Short Category rebounded quite a lot but did not entirely recoup their earlier losses. The index really rebounded because it is at the full duration for the category. Importantly, even though the risk of default in municipal bonds has gone through the roof because of the Corona Lockdowns, municipal bonds are, after this months huge rebound, trading as if there has been no increase in default risk. In light of the huge increase in likely defaults in the municipal bond market, we ask, where are the municipal bond rating downgrades? Where is the huge increase in credit quality yield spreads? (in fact, the opposite happened during May 2020 – credit quality yield spread tightened up dramatically from the earlier widening). All we can say is, hold on to your hats if you have much credit risk or duratin risk in the municipal bond market.
Stamper Capital & Investments, Inc.
Separately Managed Accounts (National Tax-Free) vs. Tax-Free Municipal Bond Indices
Annual Total Returns, Period Ended 5-31-2020
| PERIOD | Morningstar Muni Short Category | SCI Separately Managed Tax-Fee Municipal Accounts Composite Net of Fees | SCI Separately Managed Accounts Net Pre-Tax Equivalent* | Bloomberg Barclay’s 3 Year Tax-Free Muni Bond Index |
|---|---|---|---|---|
| 1 Year | 1.88% | 2.43% | 3.74% | 3.39% |
| 3 Years | 1.66% | 2.47% | 3.80% | 2.19% |
| 5 Years | 1.44% | 2.18% | 3.36% | 1.96% |
| 10 Years | 1.27% | 2.03% | 3.13% | 1.64% |
| 15 Years | 2.06% | 2.73% | 4.20% | 2.65% |
| Since Inception (1/1/1995) | N/A | 3.89% | 5.98% | N/A |
Note: Indices do not have fees (trading costs, custody fees, management fees, etc.) deducted from their returns. We now have a much more reasonable index to compare to – the Bloomberg Barclay’s 3 Year Tax-Free Municipal Index. We still aim for similar or better returns with less risk – The key with this table is that our longer term pre-tax municipal bond returns are noticeably higher than the bond market index but with What We Think is less risk – we will see when rates start to rise and/or credit quality yield spreads widen.
Please see the Disclaimer and Footnotes at the bottom of the page for more information.
* at 35% Federal tax rate
June 8, 2020
Well, the stock market rectracement rally, of the huge drop earlier in the year, has retraced more and/or rebounded more than we thought. And, certainly, it is somewhat irrational. NABE just declared that a recession started in February of this year (2020) & unemployment is off the charts, etc. etc. etc. We previously documented that the economy was weakening back in the late 3rd quarter of 2019 based on Federal Reserve operations to the Bank Repo Lending Market (and again later in December 2019). The graph of the Fed’s balance sheet has now been published and it shows those times are when the Fed started dramatically growing its Balance Sheet (it had been contracting slowly for a couple of years, per their announced policies). Very importantly, we have yet to see the HUGE RIPPLE that is from the Corona Virus Lockdowns. Just around the corner are going to be multiple and huge bankruptcies – most obviously in the commercial real estate sector – but there will be lots and lots of sectors getting hurt and this contraction will spread from sector to sector to sector. Thus, it is amazing that stocks have been able to rebound so much. Another area is residential real estate – this sector should (eventually) be hit hard. We think this is true for all risky asset classes, especially those heavily financed with debt which most are. Certainly the risk level of essentially everything has stepped up dramatically, which means, in a rational market, buyers must be compensated more for the increased risk – by purchasing those assets at much lower prices. This goes for stocks, bonds, real estate, even precious metals (which are heavily financed and speculated in). In addition, at least the short term trend of high quality (U.S. Treasuries) interest rates is now upwards. We believe this small upward move is the beginning of a much larger move up in interest rates. One thing for Residential Real Estate is the mortgage rates have not gone up at all (even though the risk of default has skyrocketed). Although there has been a “stealth” rise in interest rates – We have read that it is now nearly impossible to get a jumbo loan – so while the quoted rate hasn’t risen, you can’t borrow at that rate; this situation is probably true for bank loans for any risky categories. In fact, we have read that several of the large banks have ceased to make automobile purchase loans! Unfortunately, we expect there will be all kinds of bad news about all these risky asset classes – how payments aren’t being made (or received) and how that is rippling around the economy.
Our belief is the stock market rally is about out of gas and the Huge initial drop that we forecasted will resume, with new a Huge drop down far below the low of earlier this year – with less liquid assets finally printing prices at much lower levels (so far mostly they are quoted as unchanged – think Residential Real Estate – there have been very few transactions/prints during the Lockdowns). Then, from that low, we should see another pretty big retracement before putting in the final leg down to an even lower low.
May 14, 2020
We continued to do well in these very volatile times. For April 2020, generally, the muni market got back a good part of its loses of the previous month during the first half of April, but then trended down (in price, up in yield) for the latter half of the month. In May, so far, the market has traded up (in price, down in yield) quite a bit. We find this amazing as the economic fundmentals being report are hugely negative and imply a definite large increase in default risk even possibly up to the highest credit-quality issuers. Of course, the wild card is government bailouts of which the municipal bond market is supposed to participate – just who or which, and how will be interesting.
Stamper Capital & Investments, Inc.
Separately Managed Accounts (National Tax-Free) vs. Tax-Free Municipal Bond Indices
Annual Total Returns, Period Ended 4-30-2020
| PERIOD | Morningstar Muni Short Category | SCI Separately Managed Tax-Fee Municipal Accounts Composite Net of Fees | SCI Separately Managed Accounts Net Pre-Tax Equivalent* | Bloomberg Barclay’s 3 Year Tax-Free Muni Bond Index |
|---|---|---|---|---|
| 1 Year | 0.86% | 2.46% | 3.78% | 2.07% |
| 3 Years | 1.26% | 2.48% | 3.81% | 1.72% |
| 5 Years | 1.06% | 2.17% | 3.34% | 1.53% |
| 10 Years | 1.34% | 2.05% | 3.15% | 1.69% |
| 15 Years | 1.97% | 2.71% | 4.16% | 2.53% |
| Since Inception (1/1/1995) | N/A | 3.89% | 5.99% | N/A |
Note: Indices do not have fees (trading costs, custody fees, management fees, etc.) deducted from their returns. We now have a much more reasonable index to compare to – the Bloomberg Barclay’s 3 Year Tax-Free Municipal Index. We still aim for similar or better returns with less risk – The key with this table is that our longer term pre-tax municipal bond returns are noticeably higher than the bond market index but with What We Think is less risk – we will see when rates start to rise and/or credit quality yield spreads widen.
Please see the Disclaimer and Footnotes at the bottom of the page for more information.
* at 35% Federal tax rate
April 16, 2020
As we forecast on March 14, 2020 (below) we more than caught up to the Morningstar average one year return for the period ending 3-31-2020, the only period we lagged. As we explained, during this recent very tumultuous period only the very very highest quality bonds rallied (prices up and yields down). In fact, what we didn’t expect was that even municipal bonds pre-refunded and escrowed in U.S. Treasuries would see their prices fall (yields rise). Of course, most of the mutual funds and privately managed accounts don’t have that high of credit quality so they fared worse. However, as we said last month, “Our credit quality is very high so we expect to earn monthly returns similar to those over the past many years” and that is how we performed. I would add to that that we had very low interest rate risk. So, during this very volatile period, we outperformed based on both credit quality and interest rate risk.
Stamper Capital & Investments, Inc.
Separately Managed Accounts (National Tax-Free) vs. Tax-Free Municipal Bond Indices
Annual Total Returns, Period Ended 3-31-2020
| PERIOD | Morningstar Muni Short Category | SCI Separately Managed Tax-Fee Municipal Accounts Composite Net of Fees | SCI Separately Managed Accounts Net Pre-Tax Equivalent* | Bloomberg Barclay’s 3 Year Tax-Free Muni Bond Index |
|---|---|---|---|---|
| 1 Year | 1.29% | 2.52% | 3.88% | 1.95% |
| 3 Years | 1.50% | 2.48% | 3.81% | 1.78% |
| 5 Years | 1.13% | 2.16% | 3.33% | 1.49% |
| 10 Years | 1.43% | 2.06% | 3.17% | 1.72% |
| 15 Years | 2.04% | 2.72% | 4.18% | 2.56% |
| Since Inception (1/1/1995) | N/A | 3.90% | 5.99% | N/A |
Note: Indices do not have fees (trading costs, custody fees, management fees, etc.) deducted from their returns. We now have a much more reasonable index to compare to – the Bloomberg Barclay’s 3 Year Tax-Free Municipal Index. We still aim for similar or better returns with less risk – The key with this table is that our longer term pre-tax municipal bond returns are noticeably higher than the bond market index but with What We Think is less risk – we will see when rates start to rise and/or credit quality yield spreads widen.
Please see the Disclaimer and Footnotes at the bottom of the page for more information.
* at 35% Federal tax rate
March 15, 2020
Whoa! Unfortunately, we pretty much nailed it when we wrote in these pages on January 27, 2020:
Importantly, we believe we can watch for breaks of the parabolic uptrends as indicators of declines in the broader markets. As, I’m sure anyone reading this knows, downside volatility has just stepped up rather dramatically, attributed to the Coronavirus breakout. We don’t know if that is the cause but we do know that the markets valuations and fundamentals seem a perfect setup to us (as we’ve documented in these pages) for huge potential price declines. We see a lot of indices that have curved up – maybe not dramatic parabolic rises, but if those with parabolic rises see their prices plummet, we would expect that the prices of these curved up price graphs will follow the new sharp downward trend. Some of these would be Bitcoin (which we have been using as a “canary in the coal mine” for quite some time), the price of gold. Others with more sideways rises (with lower and lower momentum) like U.S. Domestic stock indices and prices would also likely follow along as we’ve been forecasting.
We said similar things on January 28, 2020 in our January 2020 Annual Forecast:
Forecasts for 2020 – Given the super low interest rates, the huge debt levels, and the prices of most assets at extreme overvaluation levels, and the divergences – all of which we have been documenting (here and in our previous Annual Forecasts and Blogs ) – our forecast is fairly straightforward, at least to us. Last year, as discussed above, we hedged on forecasting “The Top” because the market is so irrational. However, this year we just had two “Liquidity Events” similar to those prior to the top before the Financial Crash down into 2009. And, interest rates are lower – and super low across the entire curve. Thus, we have a lot more confidence this year, unfortunately. Also, if those rising parabolic price graphs break, it will give us more confidence that “The Top(s) is in.” If it is “in” it will be obvious very quickly as price drops will be breathtaking – swift and large. So, we should get verification fairly rapidly. Importantly, even if we are incorrect, the upside potential of almost all asset classes is very very small, while the downside is very large (at least to us) – so, to us, it makes a lot of sense to be extra defensively postured.
So our forecast is for prices of U.S. Equities, junk bonds, commodities, real estate – pretty much all higher risk asset classes – to fall. Interest rates are a tougher call, but we will stick our neck out and forecast generally rising interest rates, since they are at such low levels and across the board/curve and because of the all-time yield divergence between the Ten Year and the Thirty Year that we documented. In fact, as we have gone over so many times previously, since, generally, assets are very highly leveraged across the board right now, rising rates from such low levels will put huge pressure on prices of assets.
Ok, so the stock market over the past three weeks has fallen about 28% to the period low, with a 9% or so rebound on Friday bringing it to still down about 20%. There is a lot of press on all of this so we are just handling the unfortunate highlights. Importantly, commodities (oil, which had already been dropping, dropped from $52.78 on 2-20-2020 by 41%! down to $31.13 on 3-09-2020, before rebounding a bit) also had extreme drops as did prices of junk taxable bonds (“JNK” fell almost 14% before a rebound) and high yield municipal bonds (“HYD” fell almost 27%!!! bigger than we expected, before a rebound). Remember, for bonds, prices down, yields up – so in this case yields were up substantially. However, interest rates of the very highest quality bonds, U.S. Treasuries, fell, at least at first, before putting in noticeable rises, but with their interest rates still below where they were when this debacle started – interest rates of short U.S. Treasuries and Bills just plain dropped! Even high quality municipal bonds failed to follow the lower yields of U.S. Treasuries. Also, Bitcoin, which we also mentioned, fell about 12%, not a huge move for Bitcoin but in the same direction. Gold (“GLD”) held up at first but then fell about 9% down into Friday 3-13-2020.
Treasury Yields – On 1-31-2020 the yield on the U.S. Treasury 30 year bond was 2%. During the intial part of this financial crash it dropped, during a flight to quality, down to Just below 1% on 3-9-2020, wow 50% drop in yield. However, since then its yield has rebounded to 1.55% on last Friday, 3-13-2020 – that is quite a rebound. We think the all-time low is in and that longer term U.S. Treasury rates continue to rise from here. We think what happens to yields of short term U.S. Treasuries is more difficult, at this time, to forecast; however, they are exceptionally low now with the 3 month T-bill yield at 0.27%, we would not be surprised to see them rise also.
So, as for our forecast, yes we believe “The Top is In” and that the parabolic rises have been broken or will be if they’ve not been already. Importantly, with respect to the Repo market and liquidity, the Fed has stepped up even more dramatically during this “crisis” to give a huge amount more liquidity (over $1.5 trillion) to short term borrowers using securities as collateral. Remember what we noted (in these pages) that what was happening in the Repo market was one of the tipoffs to our forecasts.
Ok, so now what? Unfortunately, we believe we are in the middle or so of this down draft. While we highlighted, recently and over the years, the huge debt bubble we are in, the reaction to the Corona Virus is certainly taking a toll not only on the prices of securities but on the general economy. To us, it does not appear like that effect has ended yet. And, we believe its effects are going to ripple. We believe it is for these reasons (assets priced to perfection, huge debt level financing them, a slow down in the economy, etc.) that prices of high yield municipal bonds have been demolished (“HYD” down almost 27%) – all kinds of tax revenues will be lower, lots of people are going to make a lot less, etc. – THE BIG RIPPLE, unfortunately, will most likely result in a lot of defaults – mortgages, lease payments, bonds, etc. Thus, everything with any type of risk (and/or highly leveraged) is being priced down. We do not think we are near the bottom of this repricing. We do think government actions will make the declines more orderly but we think the declines will likely continue. We think we are in about the middle of the down draft, so we would expect another 30% or so (or even more!) drop in equity prices, for example. Thus, at this time, we recommend against trying to “buy the dip” – right now, we see it more as trying to grab a falling knife. Also, we expect the volatility to continue to be severe – huge ups and down like we’ve seen (8%, 9%, 10% & larger!) daily, will likely to continue and make it very difficult to be successful, especially with the continued downward bias we are forecasting.
Of course, after huge price drops, eventually, there will be an incredible buying opportunity. We expect a huge spike low and then a big rebound similar to what we saw at the bottom of the Financial Crash in 2009 but even larger. We think it will be very difficult to know when that will happen ahead of time but it may be more obvious in real time (like 2009). After the initial rebound it will likely become very very choppy, with the rebound lasting substantially longer than the time it will have taken for the entire initial drop (which we are still in). Then, probably a choppy drop from the rebound top for years down to a lower bottom (below the initial crash low) – we believe this entire process will be represented as a huge, long term structure on price/time graphs.
Real estate – Of course, real estate takes much longer to trade than stocks or bonds but we have real estate mutual funds that we do follow. Unfortunately, as forecast, the iShares U.S. Real Estate ETF (“IYR”) fell almost 27% during this crash, so far – we, think, in response to all the other asset prices falling and the prospects of people not having as much money going forward for mortgage payments and rent payments, etc. Also, mortgage refinance rates are spread off of high quality U.S. Treasury rates (or similar). It is likely their spread will be widening as their likelihood of default has just risen. And, we are now forecasting at least interest rates of longer U.S. Treasuries to go up. So you could see a triple whammy against real estate prices, unfortunately. Again, at the bottom which, for real estate, we think would be years from now, much lower prices will allow those with cash to make bargain purchases (especially compared to the last few years). Also, of course, real estate is regional; however, this drop is global and will almost certainly negatively affect the prices of all real estate, unfortunately.
We want to emphasize the speculative nature of our forecasts and these markets, in particular, with their very high level of volatility. We definitely could be wrong. Also, implementation is another risk factor. We believe the markets will continue to be very risky with huge price moves up and down for a time – making it very difficult to not lose money, unfortunately. We believe emotionally charged markets like these increase the difficulties of being successful. As always, past success, of ours or anyone else’s, does not guarantee future results. Please read all the disclaimers all over our website. Be careful and be safe.
March 14, 2020
Still lagging a bit for the one year BUT as you likely know the markets went rather haywire in late February and especially early March 2020. We do not know the exact nature of the index nor the Morningstar Category except as far as “duration” -( i.e. interest rate risk) which is short but not as short as ours is. However, more important is credit quality as during this strange economic period only the very highest quality bonds saw their yields go down (prices up) but all others saw their credit quality yield spreads widen, most rather dramatically, so their prices went down (yields up). So, it will be interesting to see how the index and the Morningstar Category average fared during March 2020. Our credit quality is very high so we expect to earn monthly returns similar to those over the past many years. Over the rest of the year we are expect credit quality yield spreads to continue to widen and all interest rates, including the highest quality, to rise (prices down).
Stamper Capital & Investments, Inc.
Separately Managed Accounts (National Tax-Free) vs. Tax-Free Municipal Bond Indices
Annual Total Returns, Period Ended 2-29-2020
| PERIOD | Morningstar Muni Short Category | SCI Separately Managed Tax-Fee Municipal Accounts Composite Net of Fees | SCI Separately Managed Accounts Net Pre-Tax Equivalent* | Bloomberg Barclay’s 3 Year Tax-Free Muni Bond Index |
|---|---|---|---|---|
| 1 Year | 3.33% | 2.54% | 3.91% | 3.81% |
| 3 Years | 2.08% | 2.51% | 3.86% | 2.24% |
| 5 Years | 1.47% | 2.14% | 3.30% | 1.76% |
| 10 Years | 1.55% | 2.10% | 3.23% | 1.82% |
| 15 Years | 2.13% | 2.72% | 4.18% | 2.63% |
| Since Inception (1/1/1995) | N/A | 3.90% | 6.00% | N/A |
Note: Indices do not have fees (trading costs, custody fees, management fees, etc.) deducted from their returns. We now have a much more reasonable index to compare to – the Bloomberg Barclay’s 3 Year Tax-Free Municipal Index. We still aim for similar or better returns with less risk – The key with this table is that our longer term pre-tax municipal bond returns are noticeably higher than the bond market index but with What We Think is less risk – we will see when rates start to rise and/or credit quality yield spreads widen.
Please see the Disclaimer and Footnotes at the bottom of the page for more information.
* at 35% Federal tax rate
February 13, 2020
Rates came back down a bit and we lagged for the one year because of our defensive posture but our long term performance is still excellent!
Stamper Capital & Investments, Inc.
Separately Managed Accounts (National Tax-Free) vs. Tax-Free Municipal Bond Indices
Annual Total Returns, Period Ended 1-31-2020
| PERIOD | Morningstar Muni Short Category | SCI Separately Managed Tax-Fee Municipal Accounts Composite Net of Fees | SCI Separately Managed Accounts Net Pre-Tax Equivalent* | Bloomberg Barclay’s 3 Year Tax-Free Muni Bond Index |
|---|---|---|---|---|
| 1 Year | 3.25% | 2.50% | 3.85% | 3.78% |
| 3 Years | 2.08% | 2.44% | 3.75% | 2.31% |
| 5 Years | 1.33% | 2.13% | 3.27% | 1.65% |
| 10 Years | 1.50% | 2.11% | 3.24% | 1.82% |
| 15 Years | 2.09% | 2.71% | 4.17% | 2.58% |
| Since Inception (1/1/1995) | N/A | 3.90% | 6.00% | N/A |
Note: Indices do not have fees (trading costs, custody fees, management fees, etc.) deducted from their returns. We now have a much more reasonable index to compare to – the Bloomberg Barclay’s 3 Year Tax-Free Municipal Index. We still aim for similar or better returns with less risk – The key with this table is that our longer term pre-tax municipal bond returns are noticeably higher than the bond market index but with What We Think is less risk – we will see when rates start to rise and/or credit quality yield spreads widen.
Please see the Disclaimer and Footnotes at the bottom of the page for more information.
* at 35% Federal tax rate
January 27, 2020
Obviously, we have been trying to call “The Top” in stocks (and resumption of downturn in commodities) for quite a while. A month or so ago we started noticing some parabolic price rises. Importantly, we have used spotting parabolic rises to call quite a few major tops and associated downdrafts over the years in these pages. Most notable was the parabolic rise and huge collapse in the price of bitcoin. On August 8, 2019 we said (double quoting ourselves):
The most recent asset to see an incredible parabolic price rise decimated is BitCoin whose collapse we forecasted based on that parabolic rise. It is now down 67% from its parabolic peak of 12-16-2017. Just two days after that peak in these pages on 12-18-2018 we wrote:
‘Right now [Bitcoin] is quoted at approx. $19,000 – what is a few dollars when it is going up and down a $500 a couple of times per day. Anyway, from March 2017 it has risen in a parabolic rise (increasing at an increasing rate to now near vertical) by a factor of 19x, or by 1800%. Accordingly, other assets priced in Bitcoin (rather than U.S. Dollars) have dropped in price 95%! – an incredible crash – across the board – all of them, if priced in Bitcoin. It is rather astounding. Looking forward, obviously it is highly speculative. Bitcoin is in a bubble, but when things are this irrational you could see further huge gains and huge bouts of volatility, up & down. It maybe, when the stock market starts its huge drop, people will, at least at first, sell stocks and move into Bitcoin (this is what happened in 2000 in Real Estate after the Tech Top but before the Tech Wreck really got going) – so it would go even higher (of course, it may not – its run maybe near over). Bitcoin could go a lot higher. But, ultimately, we believe this bubble will burst with a drop all the way down to the levels that its parabolic rise started at – so $1,000 (a 95% drop) or even lower. Bitcoin’s “market cap” is huge, so a collapse would mean a lot of people would lose a lot of money, unfortunately.’
(Note we have written considerable commentary on Bitcoin and other indices that had parabolic price rises and their resolutions in these pages)
Recently, Tesla’s (“TSLA”) price graph is one of them – It is fairly easy to see in a five year graph. It may be easier to see on longer term charts. The low was in early May 2019 at around $155 – this is where this parabolic rise starts. It rises at an increasing rate up to just over $401 on 1-22-2020. The deal with parabolic rises is that the top is very difficult to forecast its top, as the more vertical it goes, the more it feeds on itself (instead of fundamentals) and it can go quite vertical, or not. While Tesla seems to be looking a lot of future competition from the major car manufactures (Porsche and BMW), its price has kept shooting up. Some people think the rise is driven by short covering. Could be, but what we know and have documented many times in real time is that these parabolic moves most often reverse quite rapidly and the price falls all the way down to the beginning of the price move.
Another huge parabolic move we have just run into is the price of the commodity Palladium. It has kind of a compound parabolic move but especially from a low in September 2018 at above $80 rising to a high near January 2019 at about $150 with a hiccup downwards to May 2019 at about $125 and then an even steeper move up to over $200 currently (a couple of days ago, when we first discovered it).
Another one is the spectacular rise in the Semiconductor Index (“SOX). Starting on 10-1-2008 at 445.49 and rising in a huge parabolic shape up to 1,945.37 on 1-23-2020.
Importantly, we believe we can watch for breaks of the parabolic uptrends as indicators of declines in the broader markets. As, I’m sure anyone reading this knows, downside volatility has just stepped up rather dramatically, attributed to the Coronavirus breakout. We don’t know if that is the cause but we do know that the markets valuations and fundamentals seem a perfect setup to us (as we’ve documented in these pages) for huge potential price declines. We see a lot of indices that have curved up – maybe not dramatic parabolic rises, but if those with parabolic rises see their prices plummet, we would expect that the prices of these curved up price graphs will follow the new sharp downward trend. Some of these would be Bitcoin (which we have been using as a “canary in the coal mine” for quite some time), the price of gold. Others with more sideways rises (with lower and lower momentum) like U.S. Domestic stock indices and prices would also likely follow along as we’ve been forecasting.
Repo Market, Fed Funds, Fed Balance Sheet (resumption of asset (bonds) purchases). We first touched on this subject below on September 25th, 2019 – pointing out that we just saw what we called a “ripple” in the financial markets similar to what we saw prior to the Financial Crash. We talked about how we saw (and documented back then) similar ripples a few months apart back in 2007, which turned out to be the Lehman Bros derivative crisis, which is arguably the cause of the Financial Crash (along with the huge debt buildup, etc. that we documented over and over) down into early 2009. Since 9-25-2019 there has been a second ripple. Another liquidity squeeze whose cause has still not been explained (similarly to early and mid 2007 when what had happened came out much later), where Fed Funds and Repo rates shot up. In addition, the Federal Reserve, which had been shrinking its balance sheet by not purchasing bonds as maturies were running off, announced that during these two ripples in 2019 that they made multiple tens of Billions of dollars plus purchases to stem those two potential panics and that they were now going to expand rather than contract their balance sheet. Note, in the run up to the Financial Crash, the Federal Reserve stepped up their purchases many months after the ripples, but this time they are stepping in concurrently with the ripples. This timing could indicate a problem even more serious than the Lehman Derivative Crisis.
Of course, as always, in all of these situations, we will see what happens.
January 13, 2020
Out-performed all periods longer than the year 2019:
Stamper Capital & Investments, Inc.
Separately Managed Accounts (National Tax-Free) vs. Tax-Free Municipal Bond Indices
Annual Total Returns, Period Ended 12-31-2019
| PERIOD | Morningstar Muni Short Category | SCI Separately Managed Tax-Fee Municipal Accounts Composite Net of Fees | SCI Separately Managed Accounts Net Pre-Tax Equivalent* | Bloomberg Barclay’s 3 Year Tax-Free Muni Bond Index |
|---|---|---|---|---|
| 1 Year | 3.14% | 2.64% | 4.06% | 3.68% |
| 3 Years | 2.02% | 2.45% | 3.77% | 2.33% |
| 5 Years | 1.33% | 2.15% | 3.30% | 1.64% |
| 10 Years | 1.53% | 2.14% | 3.29% | 1.78% |
| 15 Years | 2.07% | 2.72% | 4.19% | 2.53% |
| Since Inception (1/1/1995) | N/A | 3.91% | 6.02% | N/A |
Note: Indices do not have fees (trading costs, custody fees, management fees, etc.) deducted from their returns. We now have a much more reasonable index to compare to – the Bloomberg Barclay’s 3 Year Tax-Free Municipal Index. We still aim for similar or better returns with less risk – The key with this table is that our pre-tax municipal bond returns are noticeably higher the bond market index but with What We Think is less risk – we will see when rates start to rise and/or credit quality yield spreads widen.
Please see the Disclaimer and Footnotes at the bottom of the page for more information.
* at 35% Federal tax rate
October 13, 2019
Still lagging on the one year, but catching up and still doing very well for the longer periods:
Stamper Capital & Investments, Inc.
Separately Managed Accounts (National Tax-Free) vs. Tax-Free Municipal Bond Indices
Annual Total Returns, Period Ended 9-30-2019
| PERIOD | Morningstar Muni Short Category | SCI Separately Managed Tax-Fee Municipal Accounts Composite Net of Fees | SCI Separately Managed Accounts Net Pre-Tax Equivalent* | Bloomberg Barclay’s 3 Year Tax-Free Muni Bond Index |
|---|---|---|---|---|
| 1 Year | 3.37% | 2.88% | 4.42% | 3.93% |
| 3 Years | 1.39% | 2.41% | 3.71% | 1.62% |
| 5 Years | 1.22% | 2.14% | 3.29% | 1.44% |
| 10 Years | 1.49% | 2.16% | 3.32% | 1.78% |
| 15 Years | 2.06% | 2.74% | 4.22% | 2.46% |
| Since Inception (1/1/1995) | N/A | 3.93% | 6.05% | N/A |
Note: Indices do not have fees (trading costs, custody fees, management fees, etc.) deducted from their returns. We now have a much more reasonable index to compare to – the Bloomberg Barclay’s 3 Year Tax-Free Municipal Index. We still aim for similar or better returns with less risk – The key with this table is that our pre-tax municipal bond returns are noticeably higher the bond market index but with What We Think is less risk – we will see when rates start to rise and/or credit quality yield spreads widen.
Please see the Disclaimer and Footnotes at the bottom of the page for more information.
* at 35% Federal tax rate
September 25, 2019
Finally the Tea Leaves look like they are clearing. Unfortunately, it looks a lot like the Housing Bubble Top before the Financial Crash down into early 2009. If you don’t recall what happened then you might read our older blogs (- Deflation Watch – Elements of Market Tops– Major Trend Changes where we forecasted the 2006-2007 major top and the Financial Crash bottom down into 2009). Our Annual Forecasts (including previous year recaps) for those years could also prove useful. Finally, our article: February 2009 Presentation: “How We Achieved the Top Municipal Bond Fund Ranking At The Bottom of The Worst Downturn in the Municipal Bond Market in 30 years: An interview with B. Clark Stamper.” makes important points about how Clark Stamper noticed some “Ripples” in the markets – ripples that turned out to be very important:
We had been observing the bubble in the financial markets for quite a while and had raised the Fund’s credit quality from BB+ in the 1990’s up to single A and then up to AA, and then up to AAA, depending upon where in the credit cycle we were – hence the name change to “Strategic.” In early 2007, we noticed what we though was the first ripple of a problem related to these bubbles – at least with respect to the municipal bond market. We had already seen the housing market tumble, especially housing related stocks. I am remembering this first ripple of significance that we likely paid more attention to than most others was related to problems in the commercial paper market in around March 2007. Later, around July 2007, we noticed what we thought was the second ripple of negative significance. I am remembering it was the equity/stock of the municipal bond insurers coming into question and when the U.S. Treasury market rallied, the municipal bond market actually traded off – we hadn’t seen that in several years and it really got my attention, but apparently not a lot of other managers’.
The rest of that article talks about how we repositioned the Wells Fargo Strategic Municipal Bond Fund (previously named the Evergreen Strategic Municipal Bond Fund) in response to those “ripples” that we noticed, that later proved to be very significant for the financial markets.
Well, just a week ago we noticed such a “ripple” in the financial markets. Lots of other people noticed too, but like in 2007 we took it seriously enough to restructure our portfolio and we were able to protect our shareholders and achieve the Tip Top Performance (click the link to the article above so see it!).
Ok, what was “the ripple” this time (this cycle top)? It was a stupendous rise in the Fed Funds rate a couple of weeks ago up to as high as 10% until the Feds intervened in the market. Their target level was and is 1.75% to 2.00%. And, the same thing happened a couple of days later. Importantly, no official explanation has been given. This situation is very similar to 2007, when months after what we decribed as “the first ripple,” the “Lehman Moment” was disclosed. Then, after most of the financial media said it was not that important, the markets began to tumble in the Financial Crash.
We are not sure of the timing. But, as with Lehman (and others in 2007 and 2008) the “ripples” were related to huge debt levels and derivatives. So, we also just had a large unexpected rise in the price of oil when a Saudi oil plant was reportedly attacked by a drone. So, that large price rise may have bankrupted or put into insolvency a large financial player. Of course, we will see. Also, back in 2007 we (by ourselves, documented as outlined above) pointed out two major ripples and from memory they were about five months apart. So, who knows if we will have a similar scenario this time. But, given the huge debt and derivatives (and everything else) we have documented, potential for quick and large downside in market is very large, we believe – maybe there won’t be a “second ripple.”
Since that recent Fed Funds ripple, we have noticed several markets lining up to the downside. These moves are so far pretty small and not so noticable, which is probably why there’ve not been any media reports of it, except, to us, it is significant in that they are all going the same direction, which is downwards – stocks, bond prices (interest rates up), gold, silver, oil (retracing a large part of the recent rise discussed above), bitcoin, etc. Like we said, it is pretty subtle, but those markets have just made lower highs (or a series of lower and lower highs) and have started downwards again. To us it is also very significant that this alignment started after “the ripple” we detailed above and it seems, to us, similar to what we wrote about in 2007 – very very early in the Financial Crash down into the 2009 market bottoms. We note that Bitcoin seems to be the leader so, at this point, we will continue to watch it as the canary in the coal mine.
September 15, 2019
Here is our recent performance. We lagged in August 2019 as we don’t take much interest rate risk and interest rates plummeted (prices up); however, interest rates have risen so far in September 2019 almost exactly as much as they fell in all of August 2019, the previous month. Thus, we should capture that performance back; of course, without the extra volatility. We will see when the September 2019 numbers are tabulated. Our long term performance record remains excellent!
Stamper Capital & Investments, Inc.
Separately Managed Accounts (National Tax-Free) vs. Tax-Free Municipal Bond Indices
Annual Total Returns, Period Ended 8-31-2019
| PERIOD | Morningstar Muni Short Category | SCI Separately Managed Tax-Fee Municipal Accounts Composite Net of Fees | SCI Separately Managed Accounts Net Pre-Tax Equivalent* | Bloomberg Barclay’s 3 Year Tax-Free Muni Bond Index |
|---|---|---|---|---|
| 1 Year | 3.53% | 2.81% | 4.32% | 4.03% |
| 3 Years | 1.45% | 2.33% | 3.59% | 1.68% |
| 5 Years | 1.28% | 2.08% | 3.20% | 1.55% |
| 10 Years | 1.66% | 2.20% | 3.38% | 1.92% |
| 15 Years | 2.10% | 2.74% | 4.21% | 2.52% |
| Since Inception (1/1/1995) | N/A | 3.94% | 6.06% | N/A |
Note: Indices do not have fees (trading costs, custody fees, management fees, etc.) deducted from their returns. We now have a much more reasonable index to compare to – the Bloomberg Barclay’s 3 Year Tax-Free Municipal Index. We still aim for similar or better returns with less risk – The key with this table is that our pre-tax municipal bond returns are noticeably higher the bond market index but with What We Think is less risk – we will see when rates start to rise and/or credit quality yield spreads widen.
Please see the Disclaimer and Footnotes at the bottom of the page for more information.
* at 35% Federal tax rate
August 14, 2019
Here is our recent performance. We just changed to measuring against a more appropriate tax-free Municipal bond index – the Bloomberg Barclay’s 3 year Tax-free. While we have lagged a bit for the one year period, over all the longer periods displayed, we out-perform the Index and also the Morningstar Muni Short Category quite nicely!
Stamper Capital & Investments, Inc.
Separately Managed Accounts (National Tax-Free) vs. Tax-Free Municipal Bond Indices
Annual Total Returns, Period Ended 7-31-2019
| PERIOD | Morningstar Muni Short Category | SCI Separately Managed Tax-Fee Municipal Accounts Composite Net of Fees | SCI Separately Managed Accounts Net Pre-Tax Equivalent* | Bloomberg Barclay’s 3 Year Tax-Free Muni Bond Index |
|---|---|---|---|---|
| 1 Year | 3.16% | 2.80% | 4.31% | 3.73% |
| 3 Years | 1.33% | 2.29% | 3.53% | 1.56% |
| 5 Years | 1.26% | 2.06% | 3.17% | 1.54% |
| 10 Years | 1.68% | 2.22% | 3.41% | 1.89% |
| 15 Years | 2.12% | 2.75% | 4.22% | 2.58% |
| Since Inception (1/1/1995) | N/A | 3.94% | 6.06% | N/A |
Note: Indices do not have fees (trading costs, custody fees, management fees, etc.) deducted from their returns. We now have a much more reasonable index to compare to – the Bloomberg Barclay’s 3 Year Tax-Free Municipal Index. We still aim for similar or better returns with less risk – The key with this table is that our pre-tax municipal bond returns are noticeably higher the bond market index but with What We Think is less risk – we will see when rates start to rise and/or credit quality yield spreads widen.
Please see the Disclaimer and Footnotes at the bottom of the page for more information.
* at 35% Federal tax rate
August 4, 2019
We haven’t commented since mid-May 2019 when we said:
[T]his top is really spread out with all-time highs spread out for many years if you include commodities and junk bonds and the bank stocks. This spreading out of the top process is continuing with the new all-time highs by some (a lesser and lesser number) not followed by others (a larger and larger number) (as discussed above and below).
Looking forward it is very difficult to “know” when this widening of the topping process is going to end. However, we believe we can add to our “the top is in” list, the NASDAQ due to its more substantial drop from its just passed all-time high. It maybe the S&P 500 is done also. The Dow Industrials is more speculative – we could see a just barely new all-time high but we don’t have too. VOLITILITY – However, we believe will likely begin to see larger, more violent swings in the equity indices. We coud see a big drop in all indices and then a big rise with maybe the Dow Industrials hitting a new all-time high but other indices not fully participating in the rise and staying below their’s. Importantly, the levels at a new rebound high wouldn’t be all that higher than where prices are now and most would probably be somewhat lower.
So, several months later, as we speculated, we have had a few new all-time highs, first the Dow Jones Industrials, then the S&P 500 and finally the NASDAQ. But, almost all other stocks and indices diverged against those all-time highs, meaning they did not put in new all-time highs. In fact, many indicies, during the current rally, peaked early and put in lower highs just as the Dow, 500 and NASDAQ were putting in theirs, while some were coincident. In fact, some like the S&P Small Cap 600 have put in three successive lower highs even as the Dow Jones Industrials was putting in higher and higher (although only slightly higher) new all-time highs. So, that is a triple divergence and is normal for a major top like we believe we are seeing now.
Ok, so we had a few new all-time highs and loads of big divergences as we forecasted. Since then we most likely had major tops in late July 2019 from which almost all indices and stocks have made notable drops. For example, the Dow Jones Industrials dropped just over 3% as did the S&P500 with the NASDAQ down around 4%. Importantly, some of these drops eclipsed recent peaks on the downside. Also, along with the triple divergence we highlighted above, the S&P Small Cap 600 has had a smaller recent drop but had already dropped more and more two times previously and is now down over 11% from its all-time high back in late August 2018. Again, this is the situation for most indices. What has happened with the Dow Jones Industrials, the S&P 500 and the NASDAQ is not what is going on with the other indices and stocks.
Looking forward, we do not believe the current drop is over. In the short run we expect another drop pretty quickly and then a notable choppy rebound before resuming a new more fluid, longer drop to new lows – followed by a similar pattern. We expect essentially all stock prices to be much lower many months from now – it could even be kind of a “bee line” on a long term chart. Well, we expect the December 2018 crash lows to be taken out before a more sizeable rebound takes place. Around that time there should be a lot of negative press about the stock market – then it is time for a notable an more lengthy rebound.
We believe the forces of this stock market drop will be large enough to finally pull down real estate prices. Likely, precious metals which have been rebounding recently, will join the drop.
Interest rates – interest rates have fallen again – more than we expected – but not near the all-time lows of a couple of years ago. We will stick our neck out against the majority and forecast then end to this rally (interest rates down) and forecast a resumption of interest rates going up. This rise could easily accompany the fall in prices of other assets we speculated about, above as they are very heavily leveraged with debt.
July 12, 2019
Here is our recent performance. Be sure to look at the longer time periods!
Stamper Capital & Investments, Inc.
Separately Managed Accounts (National Tax-Free) vs. Tax-Free Municipal Bond Indices
Annual Total Returns, Period Ended 6-30-2019
| PERIOD | Morningstar Muni Short Category | SCI Separately Managed Tax-Fee Municipal Accounts Composite Net of Fees | SCI Separately Managed Accounts Net Pre-Tax Equivalent* | Bloomberg Barclay’s Municipal Bond Index |
|---|---|---|---|---|
| 1 Year | 2.92% | 2.76% | 4.25% | 6.71% |
| 3 Years | 1.22% | 2.27% | 3.49% | 2.55% |
| 5 Years | 1.17% | 2.04% | 3.13% | 3.64% |
| 10 Years | 1.73% | 2.25% | 3.46% | 4.72% |
| 15 Years | 2.13% | 2.73% | 4.21% | 4.53% |
| Since Inception (1/1/1995) | N/A | 3.94% | 6.07% | N/A |
Note: Indices do not have fees (trading costs, custody fees, management fees, etc.) deducted from their returns. The Bloomberg Barclay’s Index is a long term index, which has substantially more interest rate risk than the Morningstar Short Term Municipal Fund Category. We aim for similar returns with far less risk – The key with this table is that our pre-tax municipal bond returns are around the same as the bond market indices BUT the bond indices posted large negative returns during certain quarters during different periods.
Please see the Disclaimer and Footnotes at the bottom of the page for more information.
* at 35% Federal tax rate
June 12, 2019
Here is our recent performance:
Separately Managed Accounts (National Tax-Free) vs. Tax-Free Municipal Bond Indices
Annual Total Returns, Period Ended 5-31-2019
| PERIOD | Morningstar Muni Short Category | SCI Separately Managed Tax-Fee Municipal Accounts Composite Net of Fees | SCI Separately Managed Accounts Net Pre-Tax Equivalent* | Bloomberg Barclay’s Municipal Bond Index |
|---|---|---|---|---|
| 1 Year | 2.85% | 2.79% | 4.30% | 6.40% |
| 3 Years | 1.27% | 2.24% | 3.44% | 2.96% |
| 5 Years | 1.13% | 2.02% | 3.11% | 3.58% |
| 10 Years | 1.70% | 2.25% | 3.45% | 4.58% |
| 15 Years | 2.15% | 2.73% | 4.20% | 4.52% |
| Since Inception (1/1/1995) | N/A | 3.95% | 6.08% | N/A |
Note: Indices do not have fees (trading costs, custody fees, management fees, etc.) deducted from their returns. The Bloomberg Barclay’s Index is a long term index, which has substantially more interest rate risk than the Morningstar Short Term Municipal Fund Category. We aim for similar returns with far less risk – The key with this table is that our pre-tax municipal bond returns are around the same as the bond market indices BUT the bond indices posted large negative returns during certain quarters during different periods.
Please see the Disclaimer and Footnotes at the bottom of the page for more information.
* at 35% Federal tax rate
May 19, 2019
Equities – Last month we said:
However, we do note the Dow and the S&P are substantially closer to their all-time price highs than the Small Caps, Russell 2000 and BKX are. In addition, the downward price action of the Dow and the S&P since their all-time tops look, to us, to more likely be in corrective patterns; thus, we believe all-time new highs in those indices (Dow Industrials and S&P 500) are more likely (maybe one but not the other). We contrast that with the patterns of the Small Caps, Russell 200, and BKX which have patterns that we do not see as corrective; so, we expect “the top is in” with those indices.
A day later we added, “Seeing Junk bonds rise above their late 2018 high is another possible indication of some equity indices taking out their corresponding (in time – late 2018) all-time highs as we discussed below [which in this case is above].”
And, that is what happened. The S&P 500 put in a new all-time high; however, the Dow Jones Industrials has not, but it is close. We didn’t mention the NASDAQ, but it also put in a new all-time high. As we forecasted, the Small Caps, Russell 2000 and BKX did not put in new all-time highs and are still much further down from their’s. We now add that the Dow Jones Transports are in similar position – no new all-time high and much further down from it’s all-time peak. The form of the Transports rise and the drop from its all-time top give us confidence in specuating that its “top is in,” along with those other indices.
So, as we have pointed out so many times here – this top is really spread out with all-time highs spread out for many years if you include commodities and junk bonds and the bank stocks. This spreading out of the top process is continuing with the new all-time highs by some (a lesser and lesser number) not followed by others (a larger and larger number) (as discussed above and below).
Looking forward it is very difficult to “know” when this widening of the topping process is going to end. However, we believe we can add to our “the top is in” list, the NASDAQ due to its more substantial drop from its just passed all-time high. It maybe the S&P 500 is done also. The Dow Industrials is more speculative – we could see a just barely new all-time high but we don’t have too. VOLITILITY – However, we believe will likely begin to see larger, more violent swings in the equity indices. We coud see a big drop in all indices and then a big rise with maybe the Dow Industrials hitting a new all-time high but other indices not fully participating in the rise and staying below their’s. Importantly, the levels at a new rebound high wouldn’t be all that higher than where prices are now and most would probably be somewhat lower. So, to us, owning equities right now is very questionable.
Also, the form of the recent drop in the price of taxable junk bonds makes us believe their downtrend has likely resumed. Remember, prices of taxable junk bonds have been “the leader” in many equity price cycles. Their all-time price top was in December 2007 with its highest rebound top in July 2014, followed by another lower rebound top in July 2017, followed by the most recent lower rebound top April 30, 2019. So, for “the big picture” this indicator has been dropping for over a decade (although it has been paying a large coupon).
Then, using a very speculative and unusual technique (the T-Indicator), we wouldn’t be all that surprised to find that the equity tops are in for all equity indices as of earlier in this month (May 2019). If the markets start down and don’t look back from this Monday, it maybe that this indicator was actually very telling (but still controversial).
BitCoin – We note Bitcoin had a 15% flash crash a few days ago (over a two day period), after its several month long parabolic rise from around 4,000 to 8,000. It did rebound smartly from that flash crash but is still slightly below the recent highs that preceeded it; however, given the parabolic rise and the form of the price rebound after the flash crash (and the flash crash itself), we would expect its price to turn back downwards and head back down to where the recent parabolic rise started, so a drop of about 50%. Of course, this is a very speculative market & we will see what happens.
Interest Rates – Last month we indicated we were expecting the yield curve to shift upwards – rates up and prices down; however, the opposite happened – the curve shifted down, however, ten and thirty year U.S. Treasury yields did not take out (go below) the previous yield lows while short term interest rates did, but not by a lot. As long as yields of longer term interest rates remain above the previous low, we are open to them beginning (or resuming) their rise as we previously talked about.
May 9, 2019
Competitors bounced back almost catching us for the one year but we are strong and steady, and we are way ahead for three, five, ten and fifteen years!
Separately Managed Accounts (National Tax-Free) vs. Tax-Free Municipal Bond Indices
Annual Total Returns, Period Ended 4-30-2019
| PERIOD | Morningstar Muni Short Category | SCI Separately Managed Tax-Fee Municipal Accounts Composite Net of Fees | SCI Separately Managed Accounts Net Pre-Tax Equivalent* | Bloomberg Barclay’s Municipal Bond Index |
|---|---|---|---|---|
| 1 Year | 2.72% | 2.78% | 4.28% | 6.16% |
| 3 Years | 1.07% | 2.19% | 3.37% | 2.59% |
| 5 Years | 1.08% | 1.99% | 3.07% | 3.56% |
| 10 Years | 1.67% | 2.23% | 3.43% | 4.55% |
| 15 Years | 2.06% | 2.72% | 4.19% | 4.40% |
| Since Inception (1/1/1995) | N/A | 3.95% | 6.08% | N/A |
Note: Indices do not have management fees or trading costs deducted from returns.
We aim for similar returns with far less risk – The key with this table is that our pre-tax municipal bond returns are around the same as the bond market indices (which have no fees) BUT the bond indices posted negative returns during certain quarters during the fifteen year period.
Please see Disclaimer and Footnotes at the bottom of the page for more information.
* at 35% Federal tax rate
April 10, 2019
Junk Bonds and Equities – We note that today (at least inter-day) the Junk Bond Taxable market as measured by ETF “JNK”) has just slightly eclipsed its high on 9-28-2018 which corresponds to the current all-time highs of several domestic market indices that we detail below. At the same time the High Yield Tax-free (municipal) Bond market as measured by etf “HYD” is still below a lower low with respect to its corresponding August 2018 top. Thus, there is another divergence in highs by time between two somewhat related markets – in this case, lower quality taxable bonds compared to lower quality municipal bonds.
We point out that both of these indices had seen higher peaks earlier on – early 2013 for High Yield Municipals and early 2014 for Junk Taxable Bonds. Thus, they’ve both turned down before the equity indices which saw their all-time highs mostly late 2018 with some early 2018 (as we have detailed numerous times). Thus, another example of a very wide, in time, super top, we do believe.
Seeing Junk bonds rise above their late 2018 high is another possible indication of some equity indices taking out their corresponding (in time – late 2018) all-time highs as we discussed below.
April 9, 2019
Interest Rates – We have looked at domestic interest rates in terms of going up and down. However, we have not recently addressed the shape of the yield curve (a graph of where interest rates are from short term to intermediate term to long term, usually by length to maturity). People try to use the change in the shape of the yield curve, not so much to forecast interest rates, but to forecast the strength or weakness or direction of the economy. Importantly, the U.S. Treasury Yield Curve has been inverted off and on over the last year or so at the short end of the curve – the yield of the Three Month T-Bill has been higher than the yield of the Six Month T-Bill. More likely more importantly, the U.S. Treasury Yield Curve inverted during March 2019 with the yield of the Three Month T-bill moving above the yield of the U.S. Treasury Ten Year Bond. Now, the inversion goes along with our forecasting weakness in the economy. You could say that it means the demand in the future for money is lower than what a normal yield curve (a normal curve has successively higher interest rates higher as maturities get longer) forecasts. We note that there was a similar yield curve inversion (10 year yield higher than 3 month yield) back in Late 2006 through May 2007 – so, corresponding with the housing bubble top – actually, after the housing top but pretty much co-incident with the related equity top and before the Financial Crash down into the 2009 super low. So, to us, this yield curve inversion goes along with our forecast for a decline in the economy which should follow a large drop in stock prices.
However, as for interest rates, we want to point out you can have a yield curve inversion and still have interest rates of all maturities rising by having the entire curve shifting upwards. Normally, people would say that could happen because of increased inflation expectations. However, we want to point out that at least for higher quality bonds, it could be because of a flight to quality or a flight to liquidity – both or either domestic or internationally. Rising interest rates of short term Treasuries, intermediat Treasuries and Long Term Treasuries goes along with our forecast for higher rates in general. Of course, if it happens the way we are expecting, interest rates of lower quality bonds and issuers will go up a lot higher than those of the highest quality because the likihood of being paid back in full by lower quality issuers will be falling.
Last month we reported, “Short term interest rates have broken out to new highs in yield while longer term interest rates are still chopping and coiling sideways before what we expect will be a notable rise in their rates.” We believe intermediate and longer term interest rates have started that rise (which, we also point out, is a resumption of their rises (with their all-time lowest levels pointed out in our Intro, above)). Thus, we now expect the entire curve to resume shifting upwards in yield (down in bond prices). We expect the yield curve will flip back and forth with respect to inverting. Right now, the yield of the U.S. Ten Year Treasury is higher than any shorter maturity Treasuries (just barely, the curve is pretty flat) but the Three and Five Years have yields lower than Two Year and shorter Treasuries (so it is inverted in that respect).
Domestic Equities – As we pointed out last time, many Domestic Equity Indices are actually in Bear Markets (experienced a drop of 20% or more and have not rebounded to eclipse the inception of the drops to new highs). Right now, we are pretty much in the same spot as we were when we made that report. Here, we do want to point out that some of those indices have put in lower rebound highs and new downtrends likely have already developed. For example, the S&P Small Cap 600 Index (“SML”) put in its all-time peak on 8-31-2018 at 1098.36. It then plunged by 27.7% to the general spike low on 12-24-2018 at 793.86. From there it rebounded by 24.4% to its rebound peak of 987.87 on 2-20-2019 – so 48 days ago. That rebound peak has held; thus, the trend is downward somewhat. A lower rebound peak since then is on 4-5-2019 at 966.15. To us, it looks like the downtrend is accelerating from there. The Russell 2000 (“RUT”) and the Philadelphia KBW Bank Index have performed similarly. Contrast that with the more closely watched Dow Jones Industrials and the S&P 500 which, from their 12-24-2018 lows put in rebound peaks on 4-5-2019. To us, these also look like they may have started down, but from their weeks later rebound date.
We note the Dow Jones Industrial and S&P 500 all-time peaks came later on 10-2-18 than the small cap all-time peaks which were on 8-31-2018. Thus, you can see that these peaks are spread out, and that is what we are likely seeing right now on a smaller scale. However, we do note the Dow and the S&P are substantially closer to their all-time price highs than the Small Caps, Russell 2000 and BKX are. In addition, the downward price action of the Dow and the S&P since their all-time tops look, to us, to more likely be in corrective patterns; thus, we believe all-time new highs in those indices (Dow Industrials and S&P 500) are more likely (maybe one but not the other). We contrast that with the patterns of the Small Caps, Russell 200, and BKX which have patterns that we do not see as corrective; so, we expect “the top is in” with those indices. If those forecasts come true, we will have even more spread out all-time price tops (various indicies topping out at different times) which we expect (as we’ve detailed numerous times before) especially for a top of this magnitude. Either way, we see small possilbe upside potential in some indices but huge downside probability in pretty much all equity indices. Of course, time will tell.
March 17, 2019
The Bear Market In Stocks – “What bear market?” you say.
Back on January 20, 2019 we pointed out:
As forecasted in our 12-18-2018 update, equities resumed their downward trend with all indices dropping together precipitously to a low on 12-24-2018. The Dow Jones Industrials’ drop from its all-time top in October 2018, was 18.8%. The S&P 500 achieved a 19.8% drop from its September 2018 all-time top to that low – just two tenth of a percent short of an official “bear market” that we talked about in our previous update. Most other indices are clearly in Bear markets (20% drop or more). The Dow Jones Transports were down 25.4%; the S&P 600 Small Cap Index was down 27.8%. The KBW Bank Index (“BKX”), representing national money center banks and leading regional institutions, was down 29% from its top back in March 2018.
Importantly, as of today, essentially no major market pure equity indices have risen above their all-time highs (or highs) from 2018 – not the Dow Jones Industrials, not the S&P 500, not the NASDAQ nor NASDAQ 100, not the S&P Small Cap Index, not the Russell 2000, not the KBW Bank Index (“BKX”), etc. Thus, those that were down 20% or more, because they have not risen above their previous highs are still in downtrends and thus, are still in “Bear Markets.” Those that were not in official bear markets (didn’t drop more than 20%) are still below their 2018 (or earlier) tops, so are still in downtrends, and could be in Bear Markets but this status will be determined in the future for these indices. The reason you don’t hear that most equity indices are still in Bear Markets in the media is because the rebounds have been very large (and, historically, at tops there is a bias against “negative reporting” – of course, it would have to be so, as you have to have a lot of positivity at price tops).
Importantly, the large U.S. Equity rebound from the 12-24-2018 larger spike low is getting old in the teeth – the rebound is also losing momentum. It may have more to go but we do not think the all-time highs will be surpassed(; although there could be major divergences with some highs eclipsed but other not eclipsed). Rather than all turning down at once, we expect various stocks and indices will begin peeling off separately making the top some what round as we’ve explained numerous times previously.
Economy and Markets – “Layoff Warnings Jump: 30 Percent More California Workers Targeted,” THE SANTA CRUZ SENTINEL, 3-15-2019. “The number of California workers hit with layoff warnings is up 30% in a year. California’s Worker Adjustment and Retraining Notification Act (WARN) requires employers to inform the state of planned layoffs, facility closures or relocations at least 60 days in advance.” The article includes the caveat: “Remember a WARN notice typically involved employers with 75 or more workers; plant closure affecting any amount of employees; layoffs of 50 or more employees or a 100-mile-plus relocation. A huge chunk of Californians works at more more modest-sized businesses.” So, a possible early warning indicator of a slow down in the economy. To be honest, we think that the markets in general would turn down before such a notice is made – And, well, that is actually the case (see above) but almost everyone is missing it.
Interest Rates – Short term interest rates have broken out to new highs in yield while longer term interest rates are still chopping and coiling sideways before what we expect will be a notable rise in their rates. Intermediate term interest rates have the largest retracements (yields down) and could take out previous lows; however, we think that is unlikely. We expect in the future all duration interest rates will be rising together.
March 13, 2019
Separately Managed Accounts (National Tax-Free) vs. Tax-Free Municipal Bond Indices
Annual Total Returns, Period Ended 2-28-2019
| PERIOD | Morningstar Muni Short Category | SCI Separately Managed Tax-Fee Municipal Accounts Composite Net of Fees | SCI Separately Managed Accounts Net Pre-Tax Equivalent* | Bloomberg Barclay’s Municipal Bond Index |
|---|---|---|---|---|
| 1 Year | 2.00% | 2.70% | 4.16% | 4.13% |
| 3 Years | 0.94% | 2.10% | 3.24% | 2.28% |
| 5 Years | 0.98% | 1.93% | 2.98% | 3.44% |
| 10 Years | 1.79% | 2.26% | 3.48% | 4.55% |
| 15 Years | 1.93% | 2.68% | 4.12% | 4.08% |
| Since Inception (1/1/1995) | N/A | 3.96% | 6.09% | N/A |
Note: Indices do not have management fees or trading costs deducted from returns.
We aim for similar returns with far less risk – The key with this table is that our pre-tax municipal bond returns are around the same as the bond market indices (which have no fees) BUT the bond indices posted negative returns during certain quarters during the fifteen year period.
Please see Disclaimer and Footnotes at the bottom of the page for more information.
* at 35% Federal tax rate
February 18, 2019
Equities – Last time we commented that we thought the rebound from the 2-24-2018 lows had gone far enough and that the downdraft would likely resume soon; however, this has not been the case. The rebound has continued but it is below the all-time highs and below subsequent lower highs. We previously indicated new all-time highs were not out of the question but that overall upside is limited but the downside potential is huge. We believe this is still the case, thus, to us, buying the rally is very speculative.
We have read a few articles on who has been buying the rebound since the 2-24-2018 low. It seems it is not retail buyers who already are at record low cash levels nor it is professional buyers. However, it does seem to be largely fueled by companies purchasing their own shares. This has been a theme for a number of years; however, this segment seems to be in extreme. Now one could try to make the case that other buyers could step in from the sidelines but their cash levels are already near record lows. So, we believe this rally is about over and the downdraft will resume soon.
We also note that Junk bond prices, which have been rebounding along with stocks since their 12-24-2018 notable bottom have seen a lessening of momentum compared to equity prices. It is our experience that prices of junk bonds tend to turn before prices of equities.
Interest rates – Long term interest rates ran up a bit and then have been consolidating in choppy sideways moves. Short term interest rates went choppy sideways but look to have just started their next notable move upwards. We expect longer term interest rates to also make a notable move upwards (bond prices down).
Commodities – Financial commodity Gold has continued to chop up to new rebound highs. We are not sure how much further it has to go before a notable pull back – maybe another $20 or so per ounce. Industrial commodity Oil has been rebounding along with stocks since their 12-24-2018 lows. We expect oil (and other industrial commodities) will begin its next drop along with stocks. However, we want to say that since industrial commodities have already dropped so much (over recent years) at some time we believe they will disconnect from stocks (which will continue to drop) and show some resilience.
Bitcoin – Bitcoin is continuing to chop sideways with notable percentage swings. We believe it will join stocks in their next notable drop.
February 11, 2019
Doing well with interest rates rising:
Separately Managed Accounts (National Tax-Free) vs. Tax-Free Municipal Bond Indices
Annual Total Returns, Period Ended 1-31-2019
| PERIOD | Morningstar Muni Short Category | SCI Separately Managed Tax-Fee Municipal Accounts Composite Net of Fees | SCI Separately Managed Accounts Net Pre-Tax Equivalent* | Bloomberg Barclay’s Municipal Bond Index |
|---|---|---|---|---|
| 1 Year | 1.69% | 2.66% | 4.09% | 3.26% |
| 3 Years | 0.88% | 2.08% | 3.21% | 2.15% |
| 5 Years | 1.00% | 1.93% | 2.96% | 3.57% |
| 10 Years | 1.65% | 2.27% | 3.49% | 4.55% |
| 15 Years | 1.97% | 2.69% | 4.14% | 4.14% |
| Since Inception (1/1/1995) | N/A | 3.96% | 6.09% | N/A |
Note: Indices do not have management fees or trading costs deducted from returns.
We aim for similar returns with far less risk – The key with this table is that our pre-tax municipal bond returns are around the same as the bond market indices (which have no fees) BUT the bond indices posted negative returns during certain quarters during the fifteen year period.
Please see Disclaimer and Footnotes at the bottom of the page for more information.
* at 35% Federal tax rate
January 30, 2019
T.V. & Cable T.V. Advertisers competing on what consumers will save rather than on great features, etc. – I just saw a bunch of commercials today where Advertisers were competing on how much money customers will save by switching to them from their competition rather than based on features, etc. Sure, we’ve seen this before but not commercial after commercial after commercial. This was insurance companies, cable companies, hotel rentals, hamburgers, chicken nuggets auto parts, annual credit card fees, ATM fees, internet providers, and cell phone companies. All you can eat pancakes, pasta, etc. is another form of price cutting I’m seeing advertised. Also seeing Valentine’s Day stuff on sale…in January. Similarly, we are seeing zero percent financing for cars, etc that comes and goes. We believe this strategy demonstrates a change to a deflationary posture by these companies and reflects their belief that price savings are now more important to potential customers than service and quality offerings. This change in psychology is very similar to what we documented during the transition at the top of the Housing Bubble in our previous Weblogs.
January 20, 2019
Equities – As forecasted in our 12-18-2018 update, equities resumed their downward trend with all indices dropping together precipitously to a low on 12-24-2018. The Dow Jones Industrial’s drop from its all-time top in October 2018, was 18.8%. The S&P 500 achieved a 19.8% drop from its September 2018 all-time top to that low – just two tenth of a percent short of an official “bear market” that we talked about in our previous update. Most other indices are clearly in Bear markets (20% drop or more). The Dow Jones Transports were down 25.4%; the S&P 600 Small Cap Index was down 27.8%. The KBW Bank Index (“BKX”), representing national money center banks and leading regional institutions, was down 29% from its top back in March 2018.
We didn’t get to forecast it but there was a big bounce from that 12-24-2018 low. And, we will say now that, if we are correct, there will be a lot more large bounces on the way down to much lower lows. The bounce in the Dow Jones Industrials, from that low was a whopping 13.4% and leaves the index down 5.6% from its all-time October 2018 high. The S&P Small Cap Index rebounded 16.4% and is still down 15.6% from its all-time high. So, to us this rebound has gone a bit further than we would like and new all-time highs are possible; however the rebound’s speed, all the support levels that have been breached, and all the fundamentals that we have reviewed over the years make us speculate that the rebound will end very soon if not tomorrow or Tuesday (1-22-2019) with the beginning of a very sharp and large move down to noticeable new lows.
We have already forecasted an increase in volatility and want to be clear that we expect huge, sharp moves like we have just seen and even larger, both up and down but ultimately to much lower lows. Of course, we will see.
Interest Rates – Interest rates continued to fall a bit more than we forecasted last time; however, the 30 Year U.S. Treasury bottom on 1-3-2019 at a 2.90% and is now at 3.10%. Other short term, intermediate term, and long term rates have risen similarly. We believe that drop in interest rates is over and we should see a rise to new interest rate highs and beyond. The last high in interest rates for the 30 Year was 3.45% on 11-2-2018.
Commodities – Gold has continued to chop sideways as forecast. We are looking for a resumption of its upward price trend. Oil put in a bottom a bit lower than we had expected but is now putting in a choppy sideways rebound – we expect after that its downward move will resume. So, as we’ve pointed out several times, financial commodities have disconnected with industrial commodities. We expect this will continue for a while until a point (which we hope to point out) at which they will re-sync to the downside.
Real Estate – Sales volumes have plunged and price rises have slowed to their lowest level since 2012 for December 2018. We have pointed out several times that in most investment category price tops you first see a contraction in sales volumes, which is what we have been seeing. As we have been documenting some markets are already in outright price declines. According to real estate company Redfin, prices dropped in San Jose, California (Silicon Valley) by 7.3%. Of course, San Jose, was one of the hottest markets in the up-cycle. We note that it appears that the hotter markets have cooled down the most. We believe that, if interest rates rise to new highs as we are forecasting, real estate prices will official drop. Such a drop would also go hand in hand with equities dropping sharply to new lows.
Another factor for real estate will likely impact prices of expensive real estate in high income tax states. The new tax law limiting the mortgage interest deduction to $10,000 (I believe) began at the beginning of 2018; however, people are just starting to see its impact on their 2018 taxes which they are just starting to calculate now. So, that effect on the high end market in high income tax states like California might be interesting.
Junk Bonds – Over the decades (yes, we started in 1995) we have used activity in taxable Junk Bonds (a category where Clark was a mutual fund Portfolio Manager from 1990 to 1998) as a leading indicator for the equity markets. Remarkably, the junk bond market recently just kind of froze with no new issues in December 2018 – the first month that has happened since 2008. In fact, it went without a sale for 40 days, the longest stretch in the data going back to 1995. We note that is even more remarkable because the taxable junk bond market is much larger now that it has been historically (and it will likely grow as more and more high grade companies get downgraded). The scarcity of new issues is probably due to increased borrowing costs as the yield spread between junk bonds and U.S. Treasuries has widened along with U.S. Treasury rates rising on their own over 2018.
We note that junk bonds (“JNK” ETF) put in their rebound top from 2009 Financial Crash lows in April 2014, with a lower rebound top since then in July 2017. Thus, their prices have actually been dropping for quite a while (off set by some sizeable interest income).
Bitcoin – Bitcoin is interesting. It has been chopping sideways since late November. It is currently at $3,554. We speculate that Bitcoin will break downward with stock prices (assuming we are correct on the stock market, as detailed above).
January 13, 2019
Bubble top Indication – Indications of a bubble top are useful even if they do not explicitly indicate the beginning of the down turn from that bubble top – they are a confirmation & they do help you get ready for the following downturn – they let you know that things are likely to turn in a different direction.
Recently, we have noticed numerous Real Estate Reality T.V. shows. We remember back in the Tech Top in 1999-2000 were the firstf Real Estate Reality T.V. shows; however, at that top there were only a couple of these types of shows and the amounts of monies involved were a lot less than now. For example, there was one show in that bubble top where each of two couples was given $1,000 to redo the other couples home. It was called “Trading Spaces.” That top ended with the Tech Wreck down into 2003-2004.
The Housing Bubble (2005-2007) had more Real Estate Reality T.V. Shows than the previous bubble had had. “Trading Spaces” had a revival but was joined by many more shows, that were more lavish. Then we had the Financial Crash down into 2009. Note that “Trading Spaces” went off the air in 2008 as the Housing Bubble had started its collapse. Another one popular during this bubble was “Flip This House” which aired from 2005 until the Financial Crash bottom in 2009.
Currently, in the All-Everything Top, we have about 12 Real Estate Reality T.V. shows. Noticeably, the activities are much more lavish and expensive. Typical re-do’s are $100,000 to $150,000. This is tearing walls out – total make-overs. Also, the number of shows is much more numerous than at the previous tops. The Tech Top had a couple; the Housing Bubble had five or six, and the current “All Everything Bubble” has about 12 Real Estate Reality T.V. shows including “Fixer Upper,” “Property Brothers,” “Beachfront Bargain Hunt,” “Flip This House,” “Love It or List It,” “Flipping Vegas,” “Flip or Flop,” “My Lottery Dream Home,” “Desert Flippers,” “Windy City Rehab,” etc. Also, this Bubble has more specialty real estate shows like “Building Off The Grid” & “Off The Grid On The Beach.” Another interesting aspect of this craze is that some of the people in these shows have actually become celebrities.
You may remember the Nothing Down Real Estate seminars in the Great Inflation Top of the late 1970’s. These types of seminars and books also get most popular during market bubble tops. “Flip This House”, and “San Diego House Flipping 101 (infomercial),” which are currently popular, among others, are along these lines.
As for possibly pinpointing the top of the current Real Estate bubble, the cast of “Trading Spaces” reunited “after 10 years out of the spotlight” in Spring 2018 according to People Magazine. It was a “Reunion Special” that aired in April 2018 – We think it is telling that there were no additional episodes. (Note, in October 2018 (below) we said, “We expect at some later date, it will be established that real estate prices across the country peaked in Mid 2018.” – so pretty close!)
We think the increased number of Real Estate Reality T.V. shows and the vastly increased monies for the re-do’s, and the increased status of these shows’ casts are indicative of the size of the current top – Huge.
Of course, we will see.
January 12, 2019
Doing very well in the rising rate environment:
Separately Managed Accounts (National Tax-Free) vs. Tax-Free Municipal Bond Indices
Annual Total Returns, Period Ended 12-31-2018
| PERIOD | Morningstar Muni Short Category | SCI Separately Managed Tax-Fee Municipal Accounts Composite Net of Fees | SCI Separately Managed Accounts Net Pre-Tax Equivalent* | Bloomberg Barclay’s Municipal Bond Index |
|---|---|---|---|---|
| 1 Year | 1.17% | 2.57% | 3.96% | 1.28% |
| 3 Years | 0.90% | 2.07% | 3.18% | 2.30% |
| 5 Years | 1.01% | 1.90% | 2.93% | 3.82% |
| 10 Years | 1.82% | 2.35% | 3.62% | 4.85% |
| 15 Years | 1.96% | 2.69% | 4.13% | 4.13% |
| Since Inception (1/1/1995) | N/A | 3.96% | 6.10% | N/A |
Note: Indices do not have management fees or trading costs deducted from returns.
We aim for similar returns with far less risk – The key with this table is that our pre-tax municipal bond returns are around the same as the bond market indices (which have no fees) BUT the bond indices posted negative returns during certain quarters during the fifteen year period.
Please see Disclaimer and Footnotes at the bottom of the page for more information.
* at 35% Federal tax rate
December 16, 2018
Interest Rates – Interest rates have continued to consolidate. We believe the next large rise in interest rates is due now or has just begun.
Equities -The next move down that we thought had started was delayed by a rally adding more choppy consolidation (which was not an unexpected possibility). However, now we believe that the next downward move that we were forecasted has begun as the Dow Jones Industrial Average has since dropped 6.7% and has just broken support. To us, what is going on is quite a bit more clear in other indices; for example, the S&P 500 and the S&P Small Cap Index have much more clearly broken downside support. This breakdown is also true for the Russell 2000, even more clear in the S&P Mid-Cap Index and is probably most clear for the Dow Jones Transportation Index whose latest drop is 12.3% from its 12-3-2018 top. Thus, as we spoke of previously, all the equity indices have aligned to the downside; thus, to us, along with the large percentage drops, we are in (or we will find we are in (after the fact)) a domestic equity “bear market.”
A “bear market” is officially a 20% drop. Drops from the top so far are: Dow Jones Industrial Average down 10%, S&P500 down 11.3%, NASDAQ down 14.6%, S&P Mid-Cap down 15.5%, Russell 2000 down 18.6%, Dow Jones Transportation Average down 19%, S&P Small Cap Index down 20%, and the KBW Bank Index (“BKX”), representing national money center banks and leading regional institutions, is down 24%. Unlike most of the other indices BKX is one of the few indices that topped in January 2018 rather than late September/early October 2018 (Thus the first part of the double top that we talked about).
Real Estate – Here is an article confirming our forecasts and thoughts we wrote below: “Seattle-area Home Prices drop again – down 11% in the last Six Months,” SEATTLE TIMES, 12-6-2018. “After six brutal years for buyers, everything is moving in their direction: prices are down, inventory is up, there’s less competition [to buy]…”
Here is another confirming article, “Real Estate: The Long-Anticipated New York Area Housing Slump Has Officially Arrived,” BLOOMBERG, 12-13-2018. We note that the New York area or Tri-State area, at least at the top end, has been cooling down months (even years) ahead of the rest of the country (as we have been documenting below).
Still, while pretty much across the country, sellers have had to reduce offering prices, we’ve not yet seen across-the-country price declines in real estate (yet); however that day seems to us to becoming closer. Just like with equities, we are forecasting that after a transition from some areas experiencing price drops and some still having price rises to all price movements Aligning downward – dropping all across-the-country, a “bear market” in real estate will have begun and price drops will accelerate similarly to 2008, 2009 – and similarly to what we forecasted and are seeing in equities. We expect this acceleration to be here soon. It will likely coincide with the resumption of the across-the-board equity price drops and/or along with the resumed rise in interest rates we are forecasting.
Commodities – as we forecasted, oil prices did start a choppy sideways move after its recent large drop and gold has continued to chop sideways and upwards. It looks to us like these trends will be in place for another month or so. Then, maybe we see a larger rise in gold and a resumption in the drop in the price of oil (to go along with the price drops in the other markets we are forecasting).
Bitcoin – Bitcoin has continued to drop and is now down to $3,250. Bitcoin has had an incredible drop from its parabolic price top, which we have been documenting.
November 17, 2018
Interest Rates – We see that interest rates are continuing to consolidate before the next rise we are forecasting.
Equities – Over the last month stocks rose in a choppy consolidation as forecasted. Now, we believe they have just started their next Big move downward – we believe this downward move will be noticeably larger than the initial one. As discussed (previously, below), all equity indicies did align to the downside in the previous drop so we believe the Huge Bear Market in U.S. Equities did begin in September 2018 (well, a double top as some topped out in January 2018 – of course, adjusted for inflation the top was in 2000!).
Commodities – As we speculated prices of financial commodities have disconnected (for a while) from prices of industrial commodities. For example the price of oil as fallen from $76 per barrel in mid October 2018 down to $56 per barrel as of 11-18-2018 – a large price drop of 26%. Over the same period gold has continued to chop slowly upwards. We expect gold to continue chopping upwards. Oil will probably take a “breather” and chop sideways or have a choppy partial retracement of its recent drop before resuming its downward price trend.
Real Estate – There are more and more articles of sales volume slowdowns across the country. As discussed previously, our experience is that sales volumes typically drop first, even as prices are going up – thus, indicating a potential market top. Then, prices join volumes in contracting, thus, confirming the top. This situation is what we are seeing. Right now, in order to sell, sellers are having to lower offers; to us, this is the first evidence of prices dropping. See more discussion below as to why we are fairly certain the top in real estate was in mid 2018. We expect a very notable drop in prices going forward similarly to the drop from the top of the “Housing Bubble” into the “Financial Crash.”
Bitcoin – We have talked about using Bitcoin’s price graph as an analog or model for the rest of the market with Bitcoin being the leader of the trend. On March 18, 2018 we said:
Bitcoin, whose graph we are using as a possible analog for stocks, rose from a low on 2-18-2018 by 58% to 11,078 before resuming its drop on 3-5-2018, where upon it has dropped by 32% to a level just above its previous low on 2-18-2018 (quite a wild ride!). We believe that its next down leg has started. We will be more confident when it breaks the previous low, which is nearby. If that happens, we think it is very likely the stock market will be following along to the downside.
It did put a new price low in in April 2018 and then made a long, choppy, contained (at least vs. previous volatility), sideways move. Importantly, we think that a downside break in Bitcoin just happened a few days ago. Important to us, if you look at recent short term graphs it looks like the price of Bitcoin is following the major indices, but if you look at the long term graphs (with some imagination, its not perfect) you can see that the major indices are following the form of Bitcoin’s price graph. Based on what we are seeing over the long run, we think that Bitcoin’s price graph is turning out to be a good map for the equity markets in general.
Looking forward, talking about parabolic rises and subsequent crashes, on December 18, 2017 (just after Bitcoin’s $19,000 top), we said:
But, ultimately, we believe this [Bitcoin] bubble will burst with a drop all the way down to the levels that its parabolic rise started at – so $1,000 (a 95% drop) or even lower. Bitcoin’s “market cap” is huge, so a collapse would mean a lot of people would lose a lot of money, unfortunately.
Today, after Bitcoins recent drop, its price was trading around $5,500 so still a lot of room to fall.
November 12, 2018
Here we are doing exceptionally well with interest rates rising:
Separately Managed Accounts (National Tax-Free) vs. Tax-Free Municipal Bond Indices
Annual Total Returns, Period Ended 10-31-2018
| PERIOD | Morningstar Muni Short Category | SCI Separately Managed Tax-Fee Municipal Accounts Composite Net of Fees | SCI Separately Managed Accounts Net Pre-Tax Equivalent* | Barclay’s Municipal Bond Index |
|---|---|---|---|---|
| 1 Year | 0.03% | 2.50% | 3.84% | -0.51% |
| 3 Years | 0.62% | 2.02% | 3.11% | 1.90% |
| 5 Years | 0.84% | 1.87% | 2.88% | 3.25% |
| 10 Years | 1.86% | 2.40% | 3.70% | 4.50% |
| 15 Years | 1.96% | 2.71% | 4.17% | 4.10% |
| Since Inception (1/1/1995) | N/A | 3.98 | 6.12% | N/A |
Note: Indices do not have management fees or trading costs deducted from returns.
We aim for similar returns with far less risk – The key with this table is that our pre-tax municipal bond returns are around the same as the bond market indices (which have no fees) BUT the bond indices posted negative returns during certain quarters during the fifteen year period.
Please see Disclaimer and Footnotes at the bottom of the page for more information.
* at 35% Federal tax rate
October 17, 2018
Interest Rates – Last time we said that interest rates of all durations had aligned and were shooting up. They continued that interest rate rise about doubling it. This across-the-board rise was blamed as the impetus for the stock market tumbling (see below). At this point, we expect another consolidation (interest rates and bond prices moving choppy sideways in a consolidating counter-trend mini rally) before resuming the across-the-board rise in interest rates (decline in bond prices).
Stocks – Last time we said we said, “Just like the recent alignment of all durations of interest rates that happened on a smaller basis (as described above) we expect prices of all equity indices to align in a downward direction – when that happens we will be in a bear market in equities. We believe that alignment is in process right now.” And, that is what happened! We had a huge drop in the prices of equities – big enough to get the attention of the major media. Now, believe we are having counter-trend rally (upwards) in equity prices. However, some are going up and some are going the opposite direction – but mostly sideways, getting ready for the next drop that we are forecasting.
Commodities – We’ve talked a few times about the differences in financial commodities and industrial commodities and our expected divergence in their prices at certain times. For now, we believe gold and silver have put in at least intermediate bottoms and are heading upwards in price. At the same time, we see that oil has begun a drop in price and we expect that drop to resume after a counter-trend breather rally that seems to us to be due right now. So financial commodities up, and industrial commodities down. Of course, we will see.
Real Estate – Pinning down real estate prices is tricky because there is no “exchange” and it is often comparing apples to oranges. People like to compare “median prices” but “the mix” often changes. So, price comparing is difficult. However, the Phlx Hsg Sector Index is down about 28% from its peak in early 2018. Also, most equity prices of housing manufactures are down since January 2018. These stocks typically lead the prices of actual houses. Upon talking to several people in real estate, we learned that the market “softened” in mid 2018. It seems offering prices had to be lowered if you wanted to sell a house. We expect at some later date, it will be established that real estate prices across the country peaked in Mid 2018.
Our Giant Market Top Recap:
Commodities topped in 2011
Bonds topped (interest rates bottomed) in 2012 to 2016 depending upon the maturity
Stocks put in a double top: January 2018 and September 2018
Real estate topped in mid 2018
At this point, now, all these categories are aligned with prices falling. Similar to what we recently pointed out with bonds and with stocks, we expect price drops to be more pronounced now that the alignment has taken place, unfortunately.
October 10, 2018
Here we are, performing well in the rising rate environment:
Separately Managed Accounts (National Tax-Free) vs. Tax-Free Municipal Bond Indices
Annual Total Returns, Period Ended 9-30-2018
| PERIOD | Morningstar Muni Short Category | SCI Separately Managed Tax-Fee Municipal Accounts Composite Net of Fees | SCI Separately Managed Accounts Net Pre-Tax Equivalent* | Barclay’s Municipal Bond Index |
|---|---|---|---|---|
| 1 Year | 0.16% | 2.35% | 3.62% | 0.35% |
| 3 Years | 0.78% | 2.00% | 3.07% | 2.24% |
| 5 Years | 0.96% | 1.86% | 2.86% | 3.54% |
| 10 Years | 1.78% | 2.36% | 3.63% | 4.75% |
| 15 Years | 1.95% | 2.69% | 4.15% | 4.11% |
| Since Inception (1/1/1995) | N/A | 3.98 | 6.12% | N/A |
Note: Indices do not have management fees or trading costs deducted from returns.
We aim for similar returns with far less risk – The key with this table is that our pre-tax municipal bond returns are around the same as the bond market indices (which have no fees) BUT the bond indices posted negative returns during certain quarters during the fifteen year period.
Please see Disclaimer and Footnotes at the bottom of the page for more information.
* at 35% Federal tax rate
September 23, 2018
Interest Rates – Last time we said the breather correction was likely ending and “…We believe [interest rates of different durations] are setting up to align together for their next notable move upwards.” And that seems to be what has happened – interest rates of all durations have gone up together. For example, from late August 2018 through last Friday, the yield on the U.S. Ten Year Treasury has risen 23 basis points; over the same period the yield on the U.S. Two year has risen by 22 basis points; and, the yield on the Thirty Year rose 24 basis points. While yields at the shorter end of the yield curve have been rising pretty much non-stop (starting in 2014 and continuing this last month), yields of the Five Year and longer have, in their recent re-alignment upwards, risen to previous highs of early 2018. Looking forward, we believe, that after a small consolidation (which has followed the recent yield re-alignment upwards) all the yields will break out to new highs (bond prices dropping).
Stocks – Well, the Dow Jones Industrial Average broke out to new all-time highs which was not what we expected; however, normal topping processes have continued to occur. Most notably several times when the Dow was putting in new daily highs, several other major market indices were having negative days. This type of divergence is typical at changes in trend and market highs. It is not a lot but while the Industrials put in their new high, the NASDAQ is down 1.5% and the Russell 2000 (small caps) is down 1.6%. So, the huge topping process is continuing. Just like the recent alignment of all durations of interest rates that happened on a smaller basis (as described above) we expect prices of all equity indices to align in a downward direction – when that happens we will be in a bear market in equities. We believe that alignment is in process right now. The NASDAQ and the Small Caps are heading downwards. When the Dow and other Big Caps join, the bear market will have begun. If our forecast on interest rates rising continues to be correct, it will put more and more pressure on the economy and equity prices because of the incredibly high levels of debt across all sectors (and worldwide) that we have reviewed numerous times previously.
September 13, 2018
Performing well with interest rates rising:
Just as happened on a smaller scale above with respect to Interest Rates, we expect the equity indices to now align together in a downwards direction. Once they are all aligned we will be in an overall bear market in equities.
Separately Managed Accounts (National Tax-Free) vs. Tax-Free Municipal Bond Indices
Annual Total Returns, Period Ended 8-31-2018
| PERIOD | Morningstar Muni Short Category | SCI Separately Managed Tax-Fee Municipal Accounts Composite Net of Fees | SCI Separately Managed Accounts Net Pre-Tax Equivalent* | Barclay’s Municipal Bond Index |
|---|---|---|---|---|
| 1 Year | 0.19% | 2.29% | 3.52% | 0.49% |
| 3 Years | 0.94% | 1.96% | 3.02% | 2.71% |
| 5 Years | 1.14% | 1.86% | 2.87% | 4.12% |
| 10 Years | 1.69% | 2.31% | 3.55% | 4.32% |
| 15 Years | 2.05% | 2.73% | 4.20% | 4.36% |
| Since Inception (1/1/1995) | N/A | 3.98 | 6.13% | N/A |
Note: Indices do not have management fees or trading costs deducted from returns.
We aim for similar returns with far less risk – The key with this table is that our pre-tax municipal bond returns are around the same as the bond market indices (which have no fees) BUT the bond indices posted negative returns during certain quarters during the fifteen year period.
Please see Disclaimer and Footnotes at the bottom of the page for more information.
* at 35% Federal tax rate
August 19, 2018
U.S. Equities – It was just a few days after our previous update that Facebook’s (“FB”) 7-25-2018 peak and 21% decline started. Twitter (“TWTR”) had already been declining a bit but its drop from 7-25-2018 was 29%. Even Intel (“INTC”) which is a tech company but not an internet company saw its stock drop from 7-25-2018 by 9% (note INTC had already put in a previous higher peak – so it was also already declining). Netflix (“NFLX”) had put in its all time top a bit earlier on 7-09-2018 and has fallen by 24%. The NASDAQ Comp and the NASDAQ 100 both put in all-time peaks on 7-25-2018. Since then they had fairly large drops – 3.8% by the Comp and 4.2% by the 100 – followed by large counter-trend rebounds. However, while the rebound is very close, it looks to us that “the high tech tops are in.”
Holding up the market are Apple (“AAPL”) and Microsoft (“MSFT”) which are both in a parabolic rises to new highs. Right now Apple’s price chart is approaching vertical – Microsoft isn’t that far behind. We’ve documented several times indices with parabolic rises near vertical that typically collapse down to where the parabolic trend had started. We have more confidence forecasting that with indices as opposed to individual stocks. However, it will likely turn out that Apple’s stock (and/or maybe Microsoft’s) is the one to watch at this point. The most recent asset to see an incredible parabolic price rise decimated is BitCoin whose collapse we forecasted based on that parabolic rise. It is now down 67% from its parabolic peak of 12-16-2017. Just two days after that peak in these pages on 12-18-2018 we wrote:
Right now [Bitcoin] is quoted at approx. $19,000 – what is a few dollars when it is going up and down a $500 a couple of times per day. Anyway, from March 2017 it has risen in a parabolic rise (increasing at an increasing rate to now near vertical) by a factor of 19x, or by 1800%. Accordingly, other assets priced in Bitcoin (rather than U.S. Dollars) have dropped in price 95%! – an incredible crash – across the board – all of them, if priced in Bitcoin. It is rather astounding. Looking forward, obviously it is highly speculative. Bitcoin is in a bubble, but when things are this irrational you could see further huge gains and huge bouts of volatility, up & down. It maybe, when the stock market starts its huge drop, people will, at least at first, sell stocks and move into Bitcoin (this is what happened in 2000 in Real Estate after the Tech Top but before the Tech Wreck really got going) – so it would go even higher (of course, it may not – its run maybe near over). Bitcoin could go a lot higher. But, ultimately, we believe this bubble will burst with a drop all the way down to the levels that its parabolic rise started at – so $1,000 (a 95% drop) or even lower. Bitcoin’s “market cap” is huge, so a collapse would mean a lot of people would lose a lot of money, unfortunately.
The situation for the Dow Jones and S&P 500 is same as last time. Still chopping up every so slightly and sideways but with their January 2018 all-time tops still intact – we think those all-time tops will hold. The S&P Small Caps and the Russell 2000 also continue to chop up ever so much and sideways but into more slight all-time tops. We expect one more slight push to new all-time tops for these indices. Importantly, we think there tops are essentially here.
U.S. Interest Rates – Since our last forecast it has been a mixed bag with interest rates on the 10 year moving up along with some other maturities but with some shorter term interest rates moving downwards. We believe they are setting up to align together for their next notable move upwards.
Commodities – Gold and Silver have gotten clobbered with gold down 14% since April and silver down 16% since June. The media and sentiment are very negative on precious metals right now which will likely end up being a signal for a rise in their prices.
Deflation – Copper which is more of an industrial commodity than financial like gold and silver, put in a major top 12-29-2017. Since then it had chopped down and then back up to essentially the same level on 6-8-2018. Since that double top, it has fallen by 22%. That 22% drop is notable, especially because copper prices have been a leading indicator of some economic downturns. Given everything else we’ve been reporting on we think it is likely to be this time around too. However, given it has fallen so much we wouldn’t be surprised to see a rebound in copper’s price along with gold and silver.
July 22, 2018
Everything is still pretty much right on forecast.
U.S. Interest Rates – It looks to us like the choppy downward move in longer term interest rates is over. The U.S. Thirty Year put in its yield high of 3.25% on 5-17-18 and chopped down as we forecast to a low of 2.93% on 7-6-2018. We think that was the end of the choppy yield bottom and now the move is a more robust (not choppy sideways) resumption of the trend up in yields. We expect other yields to follow along in the resumption of the upward trend in interest rates.
U.S. Equities – The Dow Jones Industrials and S&P 500 continued to chop upwards in a countertrend move after their peaks in late January 2018 and subsequent near 12% drops. We do still think that is their all-time highs. Small Caps, the Russell 2000 and the NASDAQ continued to chop upwards into ever so slightly increasing new highs – definitely their momentum has slowed. As we have discussed many times before, this situation is normal for tops – especially large tops – for some major indices to top out months and sometimes years before other major indices top.
We note that the Dow Jones Industrials current rebound high is below its highest rebound high of 2-26-2018, while the S&P 500’s rebound high is the highest “chop” up since its top. Again, this is normal. However, and importantly, all the indices should start to sync-up for the next drop and we think that is exactly what is happening. We believe the next drop, if it did not start last week, is imminent. While most of the major press and financial media missed the top, the next decline should be prominently featured in the press once it gets going.
U.S. Dollar – The U.S. Dollar has continued its choppy corrective sideways move. We expect it will rally as stocks and bonds plummet. Although, we do not think the U.S. Dollar will rally as much as the other assets drop – in other words, we expect its rally to be shorter than the drops of the other assets. In fact, at some point it may turn and join the trend downwards.
Real Estate – More market-top-change indicators are flashing for real estate. As we’ve noted previously, some of the largest markets are already down notably, especially at the high end – Canada, London, and New York City are some we’ve documented previously and further weakness in those markets has been occurring. For the broader U.S. housing market – new home construction starts are down 12.3% across the nation to a nine month low (however, it only looks like a blip on the long term chart). It is the largest drop in a year and a half. Importantly, this is during Summer, which is rarely a time when housing starts drop. Also, we’ve seen more than a couple of articles on different areas where sales volumes of real estate transactions have dropped even while prices have continued to rise. This divergence, while not proof of a coming downturn in prices, is typical behavior at a major market top. If interest rates resume their rise as we expect, we think that this time their rise will likely have a negative impact on real estate (and other asset) prices. Of course, time will tell.
July 13, 2018
Rising Rates, our bread & butter:
Separately Managed Accounts (National Tax-Free) vs. Tax-Free Municipal Bond Indices
Annual Total Returns, Period Ended 6-30-2018
| PERIOD | Barclay’s Municipal Bond Index | Morningstar Muni Short Category | SCI Separately Managed tax-free Muni Accounts Composite Net of Fees | SCI Separately Managed Accounts Net Pre-Tax Equivalent* |
|---|---|---|---|---|
| 1 Year | 1.56% | 0.61% | 2.28% | 3.50% |
| 3 Years | 2.85% | 0.91% | 1.94% | 2.98% |
| 5 Years | 3.53% | 1.01% | 1.79% | 2.76% |
| 10 Years | 4.43% | 1.79% | 2.33% | 3.58% |
| 15 Years | 4.13% | 1.97% | 2.71% | 4.17% |
| Since Inception (1/1/1995) | N/A | N/A | 3.99% | 6.14% |
Note: Indices do not have management fees or trading costs deducted from returns.
We aim for similar returns with far less risk – The key with this table is that our pre-tax municipal bond returns are around the same as the bond market indices (which have no fees) BUT the bond indices posted negative returns during certain quarters during the fifteen year period.
Please see Disclaimer and Footnotes at the bottom of the page for more information.
* at 35% Federal tax rate
June 13, 2018
Everything is going pretty much along our forecast.
U.S. Interest Rates – As forecasted last month, interest rates (and bond prices) have started and continued in a choppy sideways move. For example,for the U.S. Ten Year Treasury, from a yield high of 3.11% on 5-17-2018, the yield fell to 2.77% on 5-29-2018 before rising back up to 2.96% today. We expect the sideways move to continue for a while longer – so another move down in yield from the current choppy rebound high. All other maturities should move somewhat similarly. After the choppy sideways move is over, we expect the more robust rising interest rate trend to resume.
U.S. Equities – Stocks have continued to chop in a sideways corrective movement with most below their January 2018 highs. However, as mentioned last month some indicies have put in new highs – small Caps (S&P Small Cap Index and the Russel 2000). Since then the NASDAQ has also put in a new high. So, as we’ve explain numerous times, tops are most often spread out with various indices topping at different times and we expect that scenario to play out this time. At this point, we think the current rebound tops in the majority of indices are about in and similarly for those who have put in new all-time highs. Therefore, get ready for some big drops as the decline from The Top resumes.
U.S. Dollar – The U.S. Dollar came down from its 5-29-2018 top in a somewhat choppy fashion just as stocks were putting in their rebound and new highs as detailed above. Once, this corrective move is over, we expect the U.S. Dollar to continue its move upward pretty much coincidentally with stocks resuming (or starting, depending upon the index) their drops.
June 11, 2018
Still ripping up as interest rates have been rising:
Separately Managed Accounts (National Tax-Free) vs. Tax-Free Municipal Bond Indices
Period Ended 5-31-2018
| PERIOD | Barclay’s Municipal Bond Index | Morningstar Muni Short Category | SCI Separately Managed Accounts Composite Net of Fees | SCI Separately Managed Accounts Net Pre-Tax Equivalent* |
|---|---|---|---|---|
| 1 Year | 1.17% | 0.21% | 2.19% | 3.38% |
| 3 Years | 2.77% | 0.85% | 1.90% | 2.92% |
| 5 Years | 2.89% | 0.76% | 1.77% | 2.72% |
| 10 Years | 4.29% | 1.71% | 2.32% | 3.57% |
| 15 Years | 4.09% | 1.95% | 2.70% | 4.16% |
| Since Inception (1/1/1995) | N/A | N/A | 4.00% | 6.15% |
Note: Indices do not have management fees or trading costs deducted from returns.
We aim for similar returns with far less risk – The key with this table is that our pre-tax municipal bond returns are around the same as the bond market indices (which have no fees) BUT the bond indices posted negative returns during certain quarters during the fifteen year period.
Please see Disclaimer and Footnotes at the bottom of the page for more information.
* at 35% Federal tax rate
May 21, 2018
U.S. Dollar – Last time (4-15-18) we said, “The U.S. Dollar had been going largely down with a recent break up[ward] and then a choppy sideways move. We expect the U.S. Dollar will have another breakup[ward] soon, if not immediately.” And, it did, rising from 89 to 93.5 or by 5%, a sizeable move. Now, it looks like that upward move should end and we should see a choppy sideways breather move for a while before resumption of the upward move.
U.S. Equities – Even though the U.S. Dollar surprised most by rising and by rising a notable amount, Stocks continued their choppy sideways move. — Remember our model is U.S. Dollar up, every thing else pretty much downwards with leads and lags (as outlined below) — We do note that while almost all indices went choppy sideways, the Russell 2000 (small caps) did put in a slight new high; however, we do not expect other indicies to follow suit – their price levels are mostly choppy sideways (so far). We stand by our forecast that stocks will break downward out of this choppy consolidation and resume their drop that started earlier in the year. We believe that prior peak is “the peak” for the majority of equity indices.
U.S. Interest rates (bonds) – Last time we said, “Now, somewhat in concert with the U.S. Dollar going up, we expect interest rates to break upwards (prices downwards) out of their current sideways moves.” And, they did: The 10 Year rose 23 basis points to a 3.06%; the 30 Year rose by 17 basis points to a 3.20%. At the short end the 2 Year rose by 20 basis points to 2.57% and the 1 Year rose by 19 basis points to a 2.34%. We think this upward move in interest rates is almost over and that the market will start to go choppy sideways for a month or two before interest rates resume their upward trend.
Real Estate – We note an article in Bloomberg, “Free-Falling New York Rents Plunge 12% in Queens,” May, 9, 2018. The headline tells the story. We have been watching for real estate to top and turn downwards; of course, including rents. It is difficult for us to get an accurate feeling for real estate as we live about 30 minutes from the Silicon Valley where rents and prices are crazy high – possibly seeing panic buying right now or in the recent past. For this local market (as real estate is regional, driven chiefly by employment), prices will likely not drop until we see a sizable drop in the high tech stocks that are located nearby. Other areas like New York and Canada have likely seen their tops.
Healthcare Costs – This is interesting because normally we are focusing on prices that are dropping or we expect to drop. Of course, prices of health care (and insurance) are another matter and, we have written a few times over the years how we expect the skyrocketing prices of healthcare to crowd out spending on other items. In that note, another Bloomberg article is a bit shocking, “Obamacare Premiums to Surge Next Year [2019], Early Requests Show,” May 7, 2018. “The largest increases are being sought by CareFirst, which wants to nearly double [2x] the amount it charges on average for one coverage option in Maryland, and raise the cost of another in Virgina by 64%.” These are the first two states where requests to raise healthcare prices have been made public. Most of the rate increase requests are lower that those; some are actually slightly negative but most that were reported are double digit increases. Unfortunately, they did not give an average nor, better yet, a weighted average – so we will have to watch for more information on this topic but it is likely the average increase will be double digits. It will be interesting to us to see what is in store for California.
May 15, 2018
Here we are ripping up as interest rates are rising:
Separately Managed Accounts (National Tax-Free) vs. Tax-Free Municipal Bond Indices
Period Ended 4-30-2018
| PERIOD | Barclay’s Municipal Bond Index | Morningstar Muni Short Category | SCI Separately Managed Accounts Composite Net of Fees | SCI Separately Managed Accounts Net Pre-Tax Equivalent* |
|---|---|---|---|---|
| 1 Year | 1.56% | 0.25% | 2.19% | 3.37% |
| 3 Years | 2.31% | 0.61% | 1.88% | 2.89% |
| 5 Years | 2.44% | 0.58% | 1.74% | 2.67% |
| 10 Years | 4.25% | 1.70% | 2.34% | 3.60% |
| 15 Years | 4.17% | 1.99% | 2.71% | 4.18% |
| Since Inception (1/1/1995) | N/A | N/A | 4.00% | 6.16% |
Note: Indices do not have management fees or trading costs deducted from returns.
Seeking similar returns with far less risk – The key with this table is that our pre-tax municipal bond returns are around the same as the bond market indices (which have no fees) BUT the bond indices posted large negative returns during certain quarters during the fifteen year period.
Please see Disclaimer and Footnotes at the bottom of the page for more information.
* at 35% Federal tax rate
April 15, 2018
Of course, the big recent news is Syria. We do think it will have impacts on certain markets or at least run in parallel with them. The U.S. Dollar had been going largely down with a recent break up and then a choppy sideways move. We expect the U.S. Dollar will have another breakup soon, if not immediately.
As with the 2007-2009 Financial Crash, we’ve expected the U.S. Dollar to go up and prices of other assets to fall. That model worked exceptionally well during the Financial Crash and we expect it to be evident right now if one looks for it.
In that light, stocks put in their all time high in January 2018, followed by a 10% or so drop and then a choppy sideways move that we forecasted. At this point, we wouldn’t be surprised to see stock prices fall as the U.S. Dollar goes up. There may be leads and lags. In fact, if you only watched the news over the past month, you would think the U.S. stock market is up smartly, but, a look at six month graph show it has just been a choppy sideways move. We expect prices to break out of the choppy sideways move with lower prices. We think the drop could be rather dramatic.
We have been forecasting bonds and interest rates similarly to stocks. After large percentage point price drops, we have had a choppy sideways price move as we forecasted. Now, somewhat in concert with the U.S. Dollar going up, we expect interest rates to break upwards (prices downwards) out of their current sideways moves. One might ask how could U.S. interest rates go up if the U.S. Dollar is going up? Well, they can if interest rates abroad are going up even faster.
As for real estate, we are finally seeing articles pointing out how the rise in interest rates has negatively affected “affordability” of housing. At the same time we have seen a contraction in listings and in sales volumes. These are the types of things that happen at a top and at the beginning of a drop. Locally, we have seen some incredible panic buying – which is also what you see at a big price top.
Of course, we will see.
March 18, 2018
Interest Rates – As with our previous post, interest rates have continued to rise as we forecasted. We want to update last month’s paragraph on interest rates rises and to make the point (again) that this has been going on for quite a while:
The One Month T-Bill which was at essentially 0% in late 2016 is now up another 35 basis points from last month and is now at 1.70%.
The One Year T-Note which was at 0.15% in early 2015 is now 2.08%, up another 8 basis points since last month.
The Two Year T-Note which was at 0.50% in early 2015 is now 2.29%, up another 9 basis points since last month.
The Ten Year T-Note which was at its all time low of 1.37% on 7-2-2016 has dropped 4 basis points from our last month’s report (below) and is now at 2.84%.
At this point, we expect a “breather” where interest rates retrace a bit of their rise in a choppy sideways drop. We have already seen that in the Ten Year, which peaked at a 2.95% at the beginning of March. We think it should last a while longer before the next sizeable rise in yields.
Bitcoin – Bitcoin, whose graph we are using as a possible analog for stocks, rose from a low on 2-18-2018 by 58% to 11,078 before resuming its drop on 3-5-2018, where upon it has dropped by 32% to a level just above its previous low on 2-18-2018 (quite a wild ride!). We believe that its next down leg has started. We will be more confident when it breaks the previous low, which is nearby. If that happens, we think it is very likely the stock market will be following along to the downside.
Stocks – Stocks put in the choppy partial retracement rebounds we expected from the 2-8-2018 bottom. Only the NASDAQ put in a new high. The Dow Jones Industrial retracement rebound peaked 2-26-2018 and looks to us to have started downwards. We expect the stock market to take some seriously large drops soon – likely a series of lower lows and lower highs, possibly a crash. Thus, we believe “The Top is still in” with the NASDAQ Top being from a slightly higher level and later date than the rest of the equity indices.
February 18, 2018
Interest Rates – Interest rates have continued to rise as we forecasted. We want to update last month’s paragraph on interest rates rises to make the point that this has been going on for quite a while:
The One Month T-Bill which was at essentially 0% in late 2016 is now up another couple basis points from last month at 1.35%.
The One Year T-Note which was at 0.15% in early 2015 is now 2%, up another 22 basis points since last month.
The Two Year T-Note which was at 0.50% in early 2015 is now 2.20%, up another 17 basis points since last month.
The Ten Year T-Note which was at its all time low of 1.37% on 7-2-2016 has risen 38 basis points from our last month’s report (below) and is now at 2.88%.
Importantly, one of the primary factors of our longer term forecasts was and is the rise in interest rates – which we have been pointing out for years now – on top of record levels of debt. Looking forward, we expect interest rates to continue to rise in a stair-stepped fashion but likely faster than we have seen over the past couple of years (which hardly anyone noticed or wrote about) – at least faster in terms of basis points.
Bitcoin – We also used Bitcoin’s down turn from its peak as a leader in the down cycle of risky assets. It peaked 12-16-2017 or about a month and a half before stocks. Bitcoin’s 42% drop at our last report gave us extra confidence that the equity top was near. Also, we forecasted that Bitcoin’s parabolic rise would be broken – and it was – This also gave us extra confidence the equity top was near. The size of Bitcoin’s drop later reached 62%! We think Bitcoin’s current counter-trend rally will probably end with stocks’ current counter-trend rally and they will turn down somewhat in sync for their next drops. We expect stocks to break their parabolic rise also. In fact, it may be that Bitcoin’s parabolic rise and drop is a small model of the equity markets, at least from their parabolic rises & tops.
Stocks – In our Annual Forecast dated 1-28-2018, with respect to equities, we said: It is cliché but we believe we are at a “tipping point” with respect to stocks. We believe the rise in interest rates, especially the short end of the curve will derail the parabolic rise in the prices of stocks and the prices of other highly financed/leveraged assets. Typically parabolic rises are swiftly retraced so that is what we are expecting (We have correctly forecasted and documented several parabolic price peaks and breaks, in real time, in our Blogs over the many years – most recently BitCoin dropping 42% from its super parabolic peak!) Our minimum downside forecast for equities eventually is the 2009 lows, so considerably lower than currently & a bigger drop than the Financial Crash – prices of other assets would fall similarly. At that point we would sharpen our forecasts for further downside potential/probability. When do we expect this drop to start? At any time & sooner ratherthan later.
The recent big drop in stocks started the very next day on 1-29-2018. The Dow Jones Industrial Average dropped 10.4% (closing basis) to a low on 2-8-2018. Now, as reviewed in the Annual Forecast (and below), for 2017 we had forecasted two very large down then up movements with a final high in 2017. Last month and in the January 2018 Annual Forecast we acknowledged that that final had not happened yet but we expected it, “At any time & sooner rather than later.” It looks like we got the high 1-29-2018.
Is “The Top In?” Given all the research we have published on this topic and how it fits, we think it is highly likely “the top is in.” The 10% drop helps this case. However, we would like to see a couple more lower lows surrounding a lower high before we are certain of it. So far, after the drop, it has put in a somewhat choppy partial retracement counter-trend rebound, which is what we would expect for this case. We would expect it to turn down again at any time below the previous all-time high. Then, if we have a couple of lower lows surrounding a lower high – a continued “stair-stepped” downwards structure – the probability of the “top being in” rises near 100%, for us.
January 16, 2018
Bitcoin – From its high of $19,283 on 12-16-2017 Bitcoin has fallen 42%! down to $11,160 inter-day today (1-16-2018) whoa! – matching our expectations as detailed previously. In hindsight, Bitcoin broke its parabolic rise on 12-19-2017 (the day after our previous writeup). Since then it has moved very far away from that uptrend line and down much further; thus, to us, new highs are now very unlikely. However, we still expect it to fall to where its parabolic rise began – so, down to around $1,000, or even lower as talked about previously. Also, it should be noted that we have read that many “investors” in Bitcoin have financed their “investments” with credit cards and/or home equity loans. Unfortunately, these financing methods mean extra pain for those experiencing losses. We would not be surprised if most of those “investors” using those “financing methods” were late in entering the game – in other words, they are already substantially underwater after the recent large drops, unfortunately. The other important aspect, for us, of following Bitcoin and its recent moves, is the implication with respect to investor psychology/mood. As Bitcoin drops we would not be surprised to see the mood of investors in other asset classes (like stocks) to turn negative, resulting in falling prices. Given the huge and rapid drop of Bitcoin over the past month (and given everything we have written below in these pages), we would not be surprised to see prices of equities turn down notably. Of course, we will see.
Interest Rates – While stocks are up at record highs, looking forward, we think the real important thing to be focused on looking backwards is the rise in interest rates over the past couple of years, especially at the short end of the yield curve.
The One Month T-Bill which was at essentially 0% in late 2016 is now at 1.32%.
The One Year T-Note which was at 0.15% in early 2015 is now at 1.78%
The Two Year T-Note which was at 0.50% in early 2015 is now at 2.03%
The Ten Year T-Note which was at its all time low of 1.37% on 7-2-2016 is now at 2.50%, resuming its rise from a 9-15-2017 low of 2.05% (matching our forecast, below).
Importantly, the rises in interest rates, which are already substantial and we are expecting to continue, will put pressure on prices of all heavily financed assets, which, today, includes pretty much everything. What is amazing is that there has been nary a “peep” in the major media nor the financial press. We would not be surprised for the impact of the rise in interest rates to be felt, heavily, in 2018.
Equities – Well, for 2017 we forecasted a couple of large “down then up movements” culminating in the final top. We got the two large “down then up movements” and into new record highs but the second up movements have continued in to 2018. However, not by much compared to the risk taken (as of yet). We would not be surprised if last week’s Closing highs were the all-time highs (today there were some inter-day all-time highs before large drops). As before and even more so, we see the upside potential as minimal compared to the huge potential downside. Time will tell whether our forecast has been useful or not.
Note: We are still ripping up in Muniland!
Separately Managed Accounts
Stamper National Tax-Free vs. Tax-Free Municipal Bond Indices
Period Ended 12-31-2017
| PERIOD | Barclay’s Municipal Bond Index | Morningstar Muni Short Category | SCI Separately Managed Accounts Composite Net of Fees | SCI Separately Managed Accounts Net Pre-Tax Equivalent* |
|---|---|---|---|---|
| 1 Year | 5.45% | 1.77% | 2.14% | 3.29% |
| 3 Years | 2.98% | 0.82% | 1.64% | 2.83% |
| 5 Years | 3.02% | 0.80% | 1.70% | 2.62% |
| 10 Years | 4.46% | 1.85% | 2.35% | 3.62% |
| 15 Years | 4.40% | 2.15% | 2.71% | 4.16% |
| Since Inception (1/1/1995) | N/A | N/A | 4.02% | 6.19% |
Note: Indices do not have management fees or trading costs deducted from returns.
Similar returns with far less risk – The key with this table is that our pre-tax municipal bond returns are around the same as the bond market indices (which have no fees) BUT the bond indices posted negative returns during certain quarters during the fifteen year period.
Please see Disclaimer and Footnotes at the bottom of the page for more information.
* at 35% Federal tax rate
December 18, 2017
Priced in Bitcoin, all other markets have completely crashed – We just wanted to point that out since it popped into our head; is true; and we’ve not read that anywhere. The crash started approximately when Bitcoin was at $2,500 in August 2017, or you could say when it was $1,000 back in March 2017 if you like rounder numbers. Right now it is quoted at approx. $19,000 – what is a few dollars when it is going up and down a $500 a couple of times per day. Anyway, from March 2017 it has risen in a parabolic rise (increasing at an increasing rate to now near vertical) by a factor of 19x, or by 1800%. Accordingly, other assets priced in Bitcoin (rather than U.S. Dollars) have dropped in price 95%! – an incredible crash – across the board – all of them, if priced in Bitcoin. It is rather astounding. Looking forward, obviously it is highly speculative. Bitcoin is in a bubble, but when things are this irrational you could see further huge gains and huge bouts of volatility, up & down. It maybe, when the stock market starts its huge drop, people will, at least at first, sell stocks and move into Bitcoin (this is what happened in 2000 in Real Estate after the Tech Top but before the Tech Wreck really got going) – so it would go even higher (of course, it may not – its run maybe near over). Bitcoin could go a lot higher. But, ultimately, we believe this bubble will burst with a drop all the way down to the levels that its parabolic rise started at – so $1,000 (a 95% drop) or even lower. Bitcoin’s “market cap” is huge, so a collapse would mean a lot of people would lose a lot of money, unfortunately.
Real Estate – “US Homebuilder Sentiment Hits Its Highest Mark Since 1999,” THE SANTA CRUZ SENTINEL, December 18, 2017: The article points out that this is the highest reading since July 1999. What this home town newspaper doesn’t point out is that there is another significant high between now and July 1999 & that was in 2004. US Homebuilder Sentiment represents an index of how home builders in the National Association of Home Builders feels – so, of course, they are conflicted – these are the builder – it is their business. However, the data is useful. Let’s see, what happened after the index peaked in 1999? Well, the “Tech Wreck” started in 2000. What happened after the index peaked in 2004? The “Housing Bubble” peaked in 2005, leading to the “Financial Crash” in stocks from 2007 to 2008. What do you think will happen this time??? It is interesting that the Homebuilder Sentiment is hitting a new high while the “‘Average Joe’” Home-Buying Conditions” index (by the University of Michigan) has been heading south since early 2015. For the previous peaks we outlined, the two indices peaked roughly coincidently (at the same time); however, this time the Buying Conditions index has been dropping for almost three years while the Builders index is peaking. We expect this “divergence” to be resolved with the HomeBuilder Sentiminet index joining the Buyers index and the real estate market in dropping (for reasons listed numerous times, below).
Deflation – On December 11, 2017, the Bloomberg Agriculture Subindex hit its lowest level since the series began in 1991. We do not have a graph of the entire series; however, we do see that the index has been dropping, in a somewhat choppy fashion, from its high around 95 in 2012, down to 47 currently, a drop of 50.5%. Since a high of about 65 in mid 2016, the index has dropped 27.7% These drops go along with our deflation forecast. So far, deflation has really only hit commodities (unless priced in Bitcoin), but it has hit them hard.
Costs of Living – Last month we talked about the continuing huge increase in healthcare insurance premiums. We still have yet to read much about it in the major press, and are looking to see if it has or will effect retail sales this holiday season.
Bonds-Interest Rates – Interest rates have continued to be contained by a choppy sideways move after their rise from 2.05% to 2.47% (U.S. Ten Year Treasury). Currently, after a small recent rise, they are in position to break out to a new large movement upwards, likely significantly past the 2.61% high earlier in 2017. The all-time low was 1.36% on July 8, 2016 (U.S. Ten Year), so the rise would be a resumption of the trend up from that all-time low. Of course, rising rates generally push the prices of heavily leveraged assets downwards.
Short Term Interest Rates – We’ve not talked about short term interest rates much but they have risen quite a lot. From a low of almost zero in late 2016, the U.S. Treasury 3-Month Bill, has risen all the way up to 1.35% today. Percentage-wise that is an incredibly large move. In just basis points it is quite a large move if your mortgage is priced off of it, or if you own 3-Month Treasury Bills. On half a million dollars, the difference in interest is $6,750 annually!
Stocks – Stocks continue to defy gravity, drifting upwards in series of high lows and higher highs. Today, the NASDAQ and the Russell 2000 (small caps) put in new highs, re-joining the Dow Industrials and the S&P 500 in new territory. Correspongingly, the VIX (volatility index) put in a new low. It maybe just one more wiggle up tomorrow or another sequence of higher lows and higher highs but, to us, the stock top is very close by.
November 19, 2017
Rubber Meets the Road Continued – Actually, only for equities. As we point out above, “the Commodities (CRB index) peaked April 2008 with a lower (20% lower) secondary peak in April 2011 – these tops have not been eclipsed…” Also, bonds peaked in price with the all time low on U.S. interest rates was on 7-2-2016 (at 2.14% on the Long Bond). In fact, the situation is somewhat similar to 1987 where interest rates had been going up for about four months before the stock market peaked in August 1987 (with the crash happening a few months later in October). So, the focus is on equities.
Equities & Risks – Last update we said, “We are at what we think is the end of the last (and final) up move” (for equities) of two large down then up moves. At this point we believe we are essentially at the end of that last up move. One better clue now is that junk bonds (ETF proxy “JNK”) have been dropping even while equities have been rising. JNK is now at levels last seen in March 2017 – it is not a huge drop but the divergence in behavior from equities is noticeable. Also, the stock market’s internals have weakened notably – the stocks at 52-week lows has eclipsed those at 52-week highs. Accordingly, we are watching very closely for drops from the Top.
Below we were also looking forward to finding out how much healthcare premiums were going to be set to rise for 2018. Our concern was if the rise is a lot, which is what we were expecting, this increased cost leave even less for other purchases including stocks. Per CNBC (Wed. 25th, 2017), “Most popular Obamacare plans cost an average of 34% more for 2018” !!! – Wow! – ugh. There is a lot of detail in their article and a lot of people are subsidized so they won’t feel the hit but those aren’t the ones buying stocks or real estate, etc.
One interesting recent happening that does not seem to be getting much press is what has happened in Saudi Arabia – a huge power struggle of sorts. We would not be surprised that it is from “push coming to shove” due to the price of oil being down so much for so long, resulting in dwindling cash reserves. It maybe that there will be extra selling at the current lower prices which could result in oil prices falling further. The resumption of falling oil prices along with non-financial commodity prices goes along with our long term forecasts. If oil prices fall, of course prices of oils stocks will fall, but also about 25% of the junk bond market is directly tied to energy, so that market would also take another hit which also lines up with our long term forecasts.
Recently, we’ve read a few articles about governments buying equities (including exchange traded funds). Most notably it came out that the Swiss government had been buying equities. Other governments like Japan had announced programs to purchase equities years ago. It maybe that the large divergence between the equity markets and the commodity markets has been, in a large part, fueled by government purchases – which would explain how the markets have been so irrational – with the volatility being so very low. Now, however, Japan has announced that it is at its target holding levels – the question is, does that mean they are full? It seems so.
Super low equity price volatility – For the cycle of the Housing Bubble and the Housing Crash (2004-2009) we used a model of: U.S. Dollar down, asset prices up; and U.S. Dollar up, asset prices down very well in understanding and forecasting that cycle. However, volatility maybe the key for the best understanding and forecasting the current super bubble top and subsequent plunge. If you get to look at a long term graph of the VIX (CBOE Volatility Index), it is striking. It goes from 79 in late 2008 (Housing Bubble/Financial Crash) down to 11.43 currently. Almost certainly, when the volatility rises, prices of assets will be plummeting. We expect big moves in both.
Interest Rates – It looks to us that the resumption of interest rates is in process. Out of the current choppy sideways move we expect interest rates to rise notably. If so, the rise in interest rates should be large enough to negatively affect the prices of highly leveraged assets like real estate, etc. One notable area that it would effect is Margin Debt – debt used to finance equity purchases which is at a dramatic all-time high. Other notable peaks that stand out in Margin Debt are near the stock top of 2000, and one corresponding with the housing bubble top (around 2007). Looking at a long term graph of Margin Debt and the Dow Jones Industrial Average, the correlation is striking; thus, when Margin Debt heads down, you would expect that stocks will be following along, or vice versa.