
Extra Disclaimer – First, we want to emphasize the speculative nature of our forecasts and these markets, in particular, with their very high level of volatility. We definitely could be wrong. Also, implementation is another risk factor. We believe the markets will continue to be very risky with huge price moves up and down for a time – making it very difficult to not lose money, unfortunately. We believe emotionally charged markets like these increase the difficulties of being successful. As always, past success, of ours or anyone else’s, does not guarantee future results. Please read all the disclaimers all over our website. Be careful and be safe.
Introduction – This blog (in Reverse Chronological Order Down Below) will document and discuss our forecast unfortunately of the very very large economic contraction.
For previous “real-time” market discussions, see The Beginning of the Super All-Everything Top – First Peak where we documented and discussed the Super Everything Top (in real time!). As with last time, we will include all the previous elements of the older blogs (- Deflation Watch – Elements of Market Tops– Major Trend Changes ) (where we forecasted the 2006-2007 major Housing Bubble top and the Financial Crash bottom in 2009) into the “The Contraction Resumes” and, then into this blog, “Calling The Super All-Everything Top” for the super top that we believed peaked in late 2021/very early 2022.
Also, see our Annual Forecasts where we Forcasted the 2000 Tech Top (before we were blogging) and several subsequent market bottoms & tops: Tech Wreck (bottom), Housing Bubble Top, & Financial Crash (bottom), etc.
Please note that, as we’ve discussed before, tops are usually rounded with various indices and media discussions occurring spread out over a longer time period than bottoms where they all spike down to the low together. Also note, the size of a rebound generally indicates the period of time required for all the various areas to top; thus, a very large top takes a long time to put itself in place. For example, the 2000 equity top actually saw some indices topping back as far as 1998 and as late as late 2000; the 2006/2007 Housing Bubble (and equities) top was actually spread out over four years. With that said, this downturn will almost certainly be just as large and we think even larger, unfortunately
The Reverse Chronological Commentary Starts Here (directly below):
7-15-2026 Our Most Recent Tax-Free Performance & The Muni Market – The bond markets had a bit of a tough time in June 2026. The Short Term Category Average lost 23 basis points on its current twelve month return and 14 basis points for the current three years (ending 6-30-2026). We held in there better at down 12 basis points for the current twelve months and down only 4 basis points for the current 36 months (ending 6-30-2026). During the month, yields on Treasuries from six months on up rose somewhat notably and the municipal bond market followed along (yields up equals prices down). The Chart below shows the short term municipal performance.
Stamper Capital & Investments, Inc.
Separately Managed Accounts (National Tax-Free) vs. Tax-Free Municipal Bond Indices
Annual Total Returns, Period Ended 6-30-2026
| PERIOD | Morningstar Muni Short Category Average | SCI Separately Managed Tax-Fee Municipal Accounts Composite Net of Fees | SCI Separately Managed Accounts Net Pre-Tax Equivalent* | Bloomberg Barclay’s 3 Year Tax-Free Muni Bond Index |
|---|---|---|---|---|
| 1 Year | 3.49% | 3.58% | 5.51% | 3.33% |
| 3 Years | 3.40% | 3.63% | 5.58% | 3.34% |
| 5 Years | 1.69% | 2.89% | 4.45% | 1.47% |
| 10 Years | 1.56% | 2.53% | 3.89% | 1.63% |
| 15 Years | 1.55% | 2.28% | 3.50% | 1.64% |
| Since Inception (1/1/1995) | N/A | 3.65% | 5.62% | N/A |
Note: Indices do not have fees (trading costs, custody fees, management fees, etc.) deducted from their returns. We now have a much more reasonable index to compare to – the Bloomberg Barclay’s 3 Year Tax-Free Municipal Index. We still aim for similar or better returns with less risk – The key with this table is that our longer term pre-tax municipal bond returns are noticeably higher than the bond market index but with What We Think is less risk – we will see when rates start to rise and/or credit quality yield spreads widen.
Please see the Disclaimer and Footnotes at the bottom of the page for more information.
* at 35% Federal tax rate
6-23-2026 – Market Comment – As we speculated, the Dow Jones Industrials and the Russell 2000 did rise up to new All-Time Highs, while the S&P 500 and the NASDAQ failed to do so. Today, the U.S. Dollar shot up to 101.41 a new one year high & somewhat of a break out. At the same time prices of precious metals, Gold & Silver have been dropping and so has the price of oil. Thus, our current model (detailed below) appears to be working rather well. Also, while long term interest rates have dropped a bit, the yield on the U.S. Two Year note has risen to its highest level in over a year and a half, up from a low of 3.387% on 2-25-2026 up to 4.16% on 6-20-26. Accordingly, in Federal Reserve in its most recent meeting has changed its posture to expecting to raise its interest rate three times by year end. Of course, the rise will affect the funding costs of many assets. It has been speculated that the reason for the recent drops in prices of gold and sliver, and even bitcoin, is due to the rise in financing those assets.
Real estate continues to melt down in selective markets but we expect the downturn to spread nationally, especially as sales volumes of houses have plummeted as we have discussed previously. We recently did a “cash flow yield investment analysis” of a single family residence in a premier California beach real estate market. Zillow estimated the house was worth $2.8 million; however, based on Zillow’s estimated monthly rental of $7,200 that it could command, that house is worth only $1.2 million (or less – for expenses we only included California property tax with no Prop. 13 carryover and no other expenses & to make the calculation simple we did not include amortization of the principal which would have made the value lower). So, on a “cash flow investment basis” it is overvalued by at least 57%. We performed similar analysis a year after the the Tech Top in 2000 and at the Top of the Housing Bubble in 2007 and had similar results. Of course, one should not rely on Zillow’s estimates. We expect larger drops from the recent real estate top than those during the two previous downturns, unfortunately.
Forecast – U.S. Dollar up and prices of most assets down (see earlier Market Comments for more specific information). Now, we believe the All-Time Top for the Dow Industrials may be in (with the S&P 500 and the NASDAQ putting in theirs per our earlier forecast); we are less confident on the Russell 2000; it may (or may not) have one small rise to another, its Final, All-Time High. Either way, the upside potential is poor and the downside probability is high, unfortunately, but, we think valuation levels of most assets are the highest, by far, of any bubble of the last 126 years. Tomorrow could be telling. We expect the Flight to the U.S. Dollar to continue.
Be careful out there.
6-18-2026 Our Most Recent Tax-Free Performance & The Muni Market – This month the short term municipal bond Category gave back about half of last month’s huge rebound – its current twelve month total return dropped about 22 basis points. We even lost about 13 basis points from our current twelve month total return which about matches the Category Average. Of course, we equaled the return with a lot less volatility, which most analysts translate into a superior risk-adjusted return. Over the longer periods we continue to do quite a bit better. We do note that the Short Term Municipal Bond Category’s longer term returns improved quite a bit from last month, which, to us, brings up an important point, as it is unlikely the longer returns improved that much due to normal improved performance. After a mutual fund has had a poor record of only One Star or Two Stars in Morningstar’s Risk-adjusted rankings, they are often closed or, more likely, merged into another much better performing fund or even moved into a different category, by changing their prospectus And, importantly, their returns are removed from all time periods. This causes what is called “Survivor Bias;” the result is that the returns of the “category average” that are then reported are overstated versus including the poor returns. So, it makes the category look better but it makes the returns of the Survivors, relative the to the improved reported returns, look worse. Thus, when we managed the Evergreen Strategic Municipal Bond fund (“VMPAX”) it had had a Five Star rating, which is in the top 10% on a risk-adjusted basis; we actually did better than that if all those funds whose performances were removed, were still included. That Surviorship Bias is the case here also, as removing those poor competitor’s returns makes the Survivor’s (our’s and others’) returns look less impressive.
Stamper Capital & Investments, Inc.
Separately Managed Accounts (National Tax-Free) vs. Tax-Free Municipal Bond Indices
Annual Total Returns, Period Ended 5-31-2026
| PERIOD | Morningstar Muni Short Category Average | SCI Separately Managed Tax-Fee Municipal Accounts Composite Net of Fees | SCI Separately Managed Accounts Net Pre-Tax Equivalent* | Bloomberg Barclay’s 3 Year Tax-Free Muni Bond Index |
|---|---|---|---|---|
| 1 Year | 3.72% | 3.70% | 5.70% | 3.68% |
| 3 Years | 3.54% | 3.67% | 5.65% | 3.38% |
| 5 Years | 1.66% | 2.89% | 4.44% | 1.39% |
| 10 Years | 1.59% | 2.52% | 3.88% | 1.65% |
| 15 Years | 1.54% | 2.29% | 3.52% | 1.63% |
| Since Inception (1/1/1995) | N/A | 3.66% | 5.62% | N/A |
Note: Indices do not have fees (trading costs, custody fees, management fees, etc.) deducted from their returns. We now have a much more reasonable index to compare to – the Bloomberg Barclay’s 3 Year Tax-Free Municipal Index. We still aim for similar or better returns with less risk – The key with this table is that our longer term pre-tax municipal bond returns are noticeably higher than the bond market index but with What We Think is less risk – we will see when rates start to rise and/or credit quality yield spreads widen.
Please see the Disclaimer and Footnotes at the bottom of the page for more information.
* at 35% Federal tax rate
6-8-2026 – Market Comment – On Friday, 6-5-2026, The Model we have been presenting was in strong force. Essentially prices of all asset categories were down and the U.S. Dollar was up. Since our previous update, previous to 6-5-2026, the Dow Jones Industrials and the Russell 2000 both ran up to new All-Time Highs. At the same time the S&P500 and the NASDAQ were cooling off a bit, dropping slightly from their All-Time Highs. Friday, 6-5-2026, was a big down day for essentially all equity indices – the largest drop was in the NASDAQ, down about 4.5% and the percentage drops were lower from there, but still sharp and notable.
We also want to point out that Bitcoin had resumed its downturn by dropping around 25% over the previous month or so. We have made the argument that bitcoin’s price action is The Leader in the topping process and down cycle. That recent drop brings it back down to down around 50%, from its All-Time Top in October 2025. Unfortunately, that percentage drop, to us, gives a reasonable indication of where other asset prices are heading. Bitcoin may be due for a bounce but, ultimately, we think it will be dropping notably lower.
The yield on the U.S. Thirty year, although it has dropped a bit from its recent high, it is back above 5% and looks to us to be moving higher. As we have reviewed several times, higher interest rates are very problematic in this so highly leveraged economy we have. In fact, debt defaults would drive the deflation we are forecasting. Relatedly, we’ve just seen some more Private Credit Market (loans) Funds “gate” or restrict withdrawals. And, of course, rising interest rates have already affected the real estate markets. Of course, the Commercial Real Estate market is already down substantially. Rising interest rates have essentially resulted in a dramatic lowering of sales volumes of residential real estate as potential sellers do not want to give up their currently low mortgage rates. Thus, the market is somewhat in a quagmire. We point out (as we have many times previously) asset sales volume declines often are followed by large price declines and that is what we are expecting in the residential real estate market in general (of course, it is regional so some areas will be more affected than others).
Gold and Silver, possible inflation/deflation indicators, have continued to fall as we speculated. Gold is down around 22% from its All-Time High; sliver is down twice as much, down about 44%. Oil is also down 44% and looks to us like its price has broken support to the downside; of course, that is very speculative given the War situation and it potential special impact on oil prices.
Forecasts: Given the structures we are seeing in the markets, we believe the “Top Is In” for the S&P500 and the NASDAQ. We are less sure on the Dow Jones Industrials and the Russell 2000; thus, we need more downside in those indices for confirmation but we expect this will be the case also. Still, given the resilience of this market even at incredibly high valuation levels over the past many years, new All-Time Highs across-the-board are still possible for equities – If that happens, new All-Time Peaks would likely occur by Summer’s end or in the Fall. Ok, we also note that the Dow Jones Transports has retraced (upwards) about 62% of its “Drop from Its Top” (their All-Time High, documented below) of 4-21-2026 and is still down around 7%. Thus, the Transports could also be a Leader in the down cycle (following Bitcoin) and its topping before the Dow Industrials reminds us of the not-often-mentioned-any-more “Dow Theory.” Here is quote from Google AI: “In Dow Theory, the Dow Jones Transportation Average (DJTA) (formerly the Railroads) often peaks first, followed later by the Dow Jones Industrial Average (DJIA). This concept, known as divergence or non-confirmation, occurs when the industrials make a new high while the transports fail to do so, signaling a weak market and a likely reversal. [1, 2, 3, 4, 5]” – as we mentioned previously (down below). As indicated previously, we expect interest rates to continue rising, causing asset prices in general to fall & we expect the U.S. Dollar to rise in price contrary to all the other prices. Thus, we think the upside potential is low and the downside probability is high for prices of most assets. Prices likely will not go straight down. As in previous down cycles that we have documented over the decades, Bear Market Counter-Trend Rallies are often very sharp and very large but, of course, the down legs will be even larger. Of course, we will see on all of this. Be careful out there.
5-19-2026 – Market Comment – On Friday, 5-15-2026, The Yield of the U.S. 30 Year Long Bond again rose above 5% as we speculated several times. Importantly, that day’s activities matched our “model” with essentially everything going down in price – stocks, bonds (interest rates up), commodities, gold, sliver, and bitcoin & the U.S. Dollar going upwards. Important to us was that the Dow Jones Industrial Average never made it to a New All-Time High although it was close. Its All-Time High was back on 2-10-2026. But the S&P500, NASDAQ’s All-Time Highs were on the day before Friday, on Thursday, 5-14-2026. The Russell 2000’s All-Time High was a bit earlier on May 6th, then a slightly lower lower high on 5-11-2026, and then another lower high on 5-14-2026. So we had a major divergence with the Dow Industrials and smaller ones between the Russell 2000 and the S&P500 and the NASDAQ. And, the Dow Transports huge run up which we highlighted below (of around 40% from April 1, 2026) to its 4-21-2026 All-Time Top and its subsequent whopping 21% drop in just a couple of weeks is still intact. It is currently down about 17%. That drop may be a good example of volatility to come in other markets.
Yesterday, on 5-18-2026 the 30 Year Yield went up more to a 5.14% and today it went up more to 5.19% – so it has fairly substantially broken to the upside. The U.S. Ten Year Yield is breaking up similarly. Pundits have been explaining these rises are due to rising inflation. And inflation may be rising (at least looking backwards and in the short run) but we think the rising interest rates have more to do with fewer U.S. Dollars internationally due to the tariffs. The result being fewer U.S. Dollars to purchase U.S. Treasuries. Reduction in demand for U.S. Treasuries resulting in lower prices which equals higher yields. Of course, at current debt levels the level of interest rates is very important to prices of assets which are highly leveraged, which, today, is pretty much everything, as we’ve reviewed so many times. Also, important to this is that the level of Japanese interest rates have also risen notably thus, making the U.S. Treasuries less appealing unless their prices are lower, which seems to be what is happening.
We expect rising interest rates to also take a toll on less liquid investments including Private Credit Loans and also real estate both Commercial and Residential. I think most people would agree that residential real estate has softened. Sales volumes are down and offering price reductions (or pulled offerings) have become the norm (in most areas, Real Estate is regional). Given the less liquid nature of these assets, which have held up mostly so far, we would not be surprised to see prices gap down. We have been seeing that in the Private Credit Markets.
Of course, we will see what happens but the downside risks seem very high to us.
5-13-2026 Our Most Recent Tax-Free Performance & The Muni Market – The short term municipal bond Category had a large rebound for the month; its total return increased by a huge 56 basis points, mostly from the rebound but also, from a poor month dropping off the current twelve months. Our total return for the current twelve months was almost unchanged, increasing by only 1 basis point but it essentially did not drop during March 2026 – so much lower volatility. For the longer periods the Category was pretty much unchanged and we gained one or two basis points.
Stamper Capital & Investments, Inc.
Separately Managed Accounts (National Tax-Free) vs. Tax-Free Municipal Bond Indices
Annual Total Returns, Period Ended 4-30-2026
| PERIOD | Morningstar Muni Short Category Average | SCI Separately Managed Tax-Fee Municipal Accounts Composite Net of Fees | SCI Separately Managed Accounts Net Pre-Tax Equivalent* | Bloomberg Barclay’s 3 Year Tax-Free Muni Bond Index |
|---|---|---|---|---|
| 1 Year | 3.94% | 3.83% | 5.89% | 4.12% |
| 3 Years | 3.28% | 3.66% | 5.64% | 3.12% |
| 5 Years | 1.61% | 2.86% | 4.41% | 1.34% |
| 10 Years | 1.56% | 2.51% | 3.86% | 1.61% |
| 15 Years | 1.57% | 2.28% | 3.51% | 1.65% |
| Since Inception (1/1/1995) | N/A | 3.66% | 5.63% | N/A |
Note: Indices do not have fees (trading costs, custody fees, management fees, etc.) deducted from their returns. We now have a much more reasonable index to compare to – the Bloomberg Barclay’s 3 Year Tax-Free Municipal Index. We still aim for similar or better returns with less risk – The key with this table is that our longer term pre-tax municipal bond returns are noticeably higher than the bond market index but with What We Think is less risk – we will see when rates start to rise and/or credit quality yield spreads widen.
Please see the Disclaimer and Footnotes at the bottom of the page for more information.
* at 35% Federal tax rate
5-4-2026 – Market Comment – On Friday (5-1-2026), the previous trading day, the S&P500, NASDAQ and Russell 2000 put in slight new All-Time-Highs; however as speculated previously (below), the Dow Jones Industrial Average diverged – it did not put in a New High (nor did the Transports, nor Banks). And, today, essentially all indices and all commodities including gold, silver and oil were all down with some down over 1%. And, importantly, as we touched on it below, the Dow Transports dropped another 4.82% bringing its “Drop From The Top” to down almost 19% and today it dropped below its previous All-Time High Peak, which puts it in a potential downtrend. While the Dow Industrials All-Time-Peak was first (so far), the Transports have fallen dramatically more. It reminds us of the not-often-mentioned-any-more Dow Theory. Here is quote from Google AI: “In Dow Theory, the Dow Jones Transportation Average (DJTA) (formerly the Railroads) often peaks first, followed later by the Dow Jones Industrial Average (DJIA). This concept, known as divergence or non-confirmation, occurs when the industrials make a new high while the transports fail to do so, signaling a weak market and a likely reversal. [1, 2, 3, 4, 5]”.
Sigh, were those the peaks? We will see. If they are, the downside is significant as we’ve documented so many times in these pages.
In addition, the yield of the 30 year U.S. Treasury Long Bond has just risen above 5%. A continuation or breakout upwards in yield would almost certainly raise some havoc in our so highly leveraged economy. The yield of the U.S. Treasury Ten Year is behaving similarly.
4-28-2026 – Market Comment – As forecast, the the S&P 500, the NASDAQ and the Russell 2000 all reached new All-Time-Highs, while the Dow Jones Industrial Average did not. We see potential ending points of equity rallies for (essentially) all equity indices, a week ago on 4-21-2026, with the Divergence between the Dow Industrials and the S&P 500, NASDAQ, Russell 2000 and Dow Transports still intact. Similarly to the Dow Industrials, we note that the bank stocks, KWB Bank Index (“BKX”) and the Regional Banking ETF (“KRE”) also put in Lower Highs on or around 4-21-2026 and so have also have a divergence against those listed above.
We also highlight that in what is likely a very significant move, from its All-Time-Top on 4-22-2026, the Dow Jones Transports fell over 14% in two days!
While our forecasting model has been (and is) U.S. Dollar up, everything else down, commentators have noted that recently it has been “Oil up and pretty much everything else down;” & it pretty difficult to argue against that over the recent weeks. That comment is in respect to not just equity prices but also commodity prices like gold and sliver and also cryptocurrencies like bitcoin. Either or both of those models seem reasonable to us going forward for a time.
We will be watching to see if prices begin to fall more precipitously. So far we’ve had the tops on 4-21-2026, price drops from those tops and then mostly choppy sideways moves.
4-14-2026 – Market Comment – Well, we expected fairly large snap back rallies in the equity indices but not as large as we have already experienced. Some indices like the S&P 500 and the NASDAQ have almost retraced the entirety of the previous declines. They are not at new All-Time Highs but are so very close. However, these rises are notably on declining volume which usually means a “fake out” rally. Still, because of the closeness to the previous All-Time Peaks we would not be surprised to see new ones in the S&P500, The NASDAQ and the Russell 2000; at the same time we would not be surprised to see a huge divergence with the The Dow Jones Industrial Average NOT putting in a new All-Time Peak. We note that part of such a Divergence is already in place as the Dow Jones Transports incredibly has already put in a significant new All-Time Peak over the past week. Whoa, is it wild out there.
4-11-2026 Our Most Recent Tax-Free Performance & The Muni Market – The short term municipal bond market had a rough March 2026. The Category average lost over 60 basis points for both the current twelve months and the current three years ending 3-31-2026. That is quite a move. Our performance was much stronger losing only one or two basis points for those current periods. While the category average had slightly surpassed our return for the three years ending 2-28-2026, we are now quite a bit ahead as you can see in the chart below. This situation points out the lower levels of volatility (often used as a measure of risk) that we typically experience compared to the category average.
Stamper Capital & Investments, Inc.
Separately Managed Accounts (National Tax-Free) vs. Tax-Free Municipal Bond Indices
Annual Total Returns, Period Ended 3-31-2026
| PERIOD | Morningstar Muni Short Category Average | SCI Separately Managed Tax-Fee Municipal Accounts Composite Net of Fees | SCI Separately Managed Accounts Net Pre-Tax Equivalent* | Bloomberg Barclay’s 3 Year Tax-Free Muni Bond Index |
|---|---|---|---|---|
| 1 Year | 3.38% | 3.82% | 5.88% | 4.41% |
| 3 Years | 3.09% | 3.61% | 5.55% | 2.85% |
| 5 Years | 1.58% | 2.84% | 4.36% | 1.38% |
| 10 Years | 1.55% | 2.50% | 3.84% | 1.64% |
| 15 Years | 1.60% | 2.28% | 3.51% | 1.69% |
| Since Inception (1/1/1995) | N/A | 3.66% | 5.63% | N/A |
Note: Indices do not have fees (trading costs, custody fees, management fees, etc.) deducted from their returns. We now have a much more reasonable index to compare to – the Bloomberg Barclay’s 3 Year Tax-Free Municipal Index. We still aim for similar or better returns with less risk – The key with this table is that our longer term pre-tax municipal bond returns are noticeably higher than the bond market index but with What We Think is less risk – we will see when rates start to rise and/or credit quality yield spreads widen.
Please see the Disclaimer and Footnotes at the bottom of the page for more information.
* at 35% Federal tax rate
4-7-2026 – Market Comment – Well, we got the downward acceleration we forecasted; however, we want to point out that markets do not usually drop straight down; more often they have violent “snap back” or “counter-trend” rallies. We’ve documented in these pages over the past 20 years such snap-back rallies of say from 15% up to 75% of a previous drop in a bear market. It looks like that is what we are seeing right now.
3-12-2026 – Market Comment – Are the All-Time Tops In? That seems to be a reasonable question to us given the increased downwards turmoil we have seen in the markets since the Iran War started. Our general forecast: “U.S.Dollar up and pretty much all other general asset prices down in price – of course, they are priced in U.S. Dollars so it is kind of a tautology! No, the U.S. Dollar is/was not doomed as many other commentators have been saying,” has been true except that oil did shoot up parabolically, even while all other financial and industrial commodities have been falling in price (or going sideways). We previously documented the parabolic run-ups in gold and silver and their likely fall, which is happening. Previous to those, we documented the same concepts for Bitcoin, which seems to be a leader in the cycle and has fallen a larger percentage. We note that most stock categories are now back levels of last year, from August to early October 2025, with some drops more significant than others. Momentum of stock prices has definitely turned down but has not really accelerated; we expect it could shortly.
We note that we have documented many dominoes that have been in place and/or have been building for even years. Thus, yes, we see the War as a possible trigger although not really the cause, although the oil spike has definitely taken a toll. We want to comment that the oil price rising will not likely cause inflation, but will cause people to cut back on other things leading to price declines in other areas – Deflation, especially if credit/debt starts to contract. An associated notable problem currently, is in the “Private Credit” markets where we have seen massive writedowns and redemptions of Private Credit Investment Vehicles “gated” (restricted). Related to that, back December2025 we complained, ““…even with the sudden Fed Window borrowing and the history that has surrounded such borrowings & the problems in the shadow banking [(Private Credit)] arena, the KWB Bank Index (“BKX”) has just shot up to an All-Time High!!!” However, even more incredibly, since then Regional Banking ETF (“KRE”) has shot to an All-Time High!!!” – We note that now, over the past couple of weeks, the KWB Bank Indes (“BKX”) and the Regional Banking ETF “KRE” have seen their share prices plummet and are back down to levels in August 2025, a downtrend.
So, while we really need a bit more of decline in some indicies like the S&P 500, we will stick our necks out and say that the TOPS ARE IN. We expect downward price acceleration will begin shortly.
We think this situation is also true for the less liquid categories like real estate. Of course, commercial and retail real estate has already gone down substantially. Residential real estate is trickier to measure as at the top or when momentum is slowing it is so often “apples to oranges” in many ways. It is not straightforward when the sales volumes are so much different; however, we make the case that if sales volumes are down, that market’s prices are, in reality, down (if prices are soft, sellers just pull their offerings; thus, hiding or at least delaying “price discovery”). It is also very regional – location, location, location is very important. And, you have different strata – the very high end, the high end, the middle, the low end, town homes, even mobile homes. But, ultimately, we think a large downtrend will real itself.
Going forward, we expect the current trends of the last couple of weeks to continue” U.S. Dollar up and prices of pretty much everything else downwards.”
Here, just for theory, we want to talk about oil & its parabolic rise. It put in a huge intra-day top of $118 on Sunday 3-8-2026, before plummeting (The official close on Monday was much lower at about $95; thus, the spike is hidden on a “closing price” basis.). However, it has been rising back up; today it was up 12% to $96. As we have documented several times, once a price is going vertical it is very difficult to predict where the parabolic rise will stop. However, we saw a drop from $118 down to $78 just days later on 3-10-2026. Whoa, you can see the volatility! Even though the rise since then is substantial, we would not be surprised if that top of $118 (intra-day basis on Sunday) holds. We do like to make the point, not just in the Oil market but in all these markets where we have been seeing such wild volatility like Bitcoin and Gold and Silver and other categories that have been seeing similar moves, that – at this juncture – being involved in these markets is not “investing,” it is “speculating.”
3-11-2026 Our Most Recent Tax-Free Performance & The Muni Market – For February 2026, the short term muni market again rallied nicely but had almost as good a month drop off resulting in a pick up in its current twelve months performance of several basis points. Our performance for the current twelve month period also improved. A good month did not drop off of the current three years, thus, resulting in a larger boost in performance for the Category Average which now surpasses our return. However, we note our “risk measured” (volatility of returns) has been significantly less & we believe our “risk taken” was even lower.
Stamper Capital & Investments, Inc.
Separately Managed Accounts (National Tax-Free) vs. Tax-Free Municipal Bond Indices
Annual Total Returns, Period Ended 2-28-2026
| PERIOD | Morningstar Muni Short Category Average | SCI Separately Managed Tax-Fee Municipal Accounts Composite Net of Fees | SCI Separately Managed Accounts Net Pre-Tax Equivalent* | Bloomberg Barclay’s 3 Year Tax-Free Muni Bond Index |
|---|---|---|---|---|
| 1 Year | 4.02% | 3.84% | 5.91% | 4.38% |
| 3 Years | 3.75% | 3.64% | 5.61% | 3.75% |
| 5 Years | 1.80% | 2.78% | 4.27% | 1.60% |
| 10 Years | 1.63% | 2.47% | 3.81% | 1.68% |
| 15 Years | 1.67% | 2.28% | 3.50% | 1.76% |
| Since Inception (1/1/1995) | N/A | 3.66% | 5.63% | N/A |
Note: Indices do not have fees (trading costs, custody fees, management fees, etc.) deducted from their returns. We now have a much more reasonable index to compare to – the Bloomberg Barclay’s 3 Year Tax-Free Municipal Index. We still aim for similar or better returns with less risk – The key with this table is that our longer term pre-tax municipal bond returns are noticeably higher than the bond market index but with What We Think is less risk – we will see when rates start to rise and/or credit quality yield spreads widen.
Please see the Disclaimer and Footnotes at the bottom of the page for more information.
* at 35% Federal tax rate
2-19-2026 Our Most Recent Tax-Free Performance & The Muni Market – For January 2026, the short term muni market rallied nicely and picked up some performance for the current twelve months; however, a good month dropped off for the current three years and it lost a bit of ground. We rallied but less than the category average for the current twelve months but held steady for the current three years with the same return as at the end of last month. We have been noting that the short term municipal bond market has been outperforming short U.S. Treasuries to the point they may be overdone, especially considering the difference in average credit risk of municipal bonds versus U.S. Treasuries. Time will tell.
Stamper Capital & Investments, Inc.
Separately Managed Accounts (National Tax-Free) vs. Tax-Free Municipal Bond Indices
Annual Total Returns, Period Ended 1-31-2026
| PERIOD | Morningstar Muni Short Category Average | SCI Separately Managed Tax-Fee Municipal Accounts Composite Net of Fees | SCI Separately Managed Accounts Net Pre-Tax Equivalent* | Bloomberg Barclay’s 3 Year Tax-Free Muni Bond Index |
|---|---|---|---|---|
| 1 Year | 3.99% | 3.80% | 5.85% | 4.37% |
| 3 Years | 3.23% | 3.55% | 5.47% | 2.99% |
| 5 Years | 1.57% | 2.75% | 4.23% | 1.40% |
| 10 Years | 1.59% | 2.46% | 3.78% | 1.66% |
| 15 Years | 1.68% | 2.27% | 3.50% | 1.74% |
| Since Inception (1/1/1995) | N/A | 3.66% | 5.62% | N/A |
Note: Indices do not have fees (trading costs, custody fees, management fees, etc.) deducted from their returns. We now have a much more reasonable index to compare to – the Bloomberg Barclay’s 3 Year Tax-Free Municipal Index. We still aim for similar or better returns with less risk – The key with this table is that our longer term pre-tax municipal bond returns are noticeably higher than the bond market index but with What We Think is less risk – we will see when rates start to rise and/or credit quality yield spreads widen.
Please see the Disclaimer and Footnotes at the bottom of the page for more information.
* at 35% Federal tax rate
2-1-2026 Market Comment – Well, I guess the obvious question after the 35% one day drop in Silver’s price is “Was that the end of the Blow-Off Top for silver?” and, if it was, “Will other asset prices be joining in on the drop?” We documented several times over the decades that it is difficult to call the top on parabolic moves – once they start going up near vertically, there are no reliable reference points to pin the top; however, once it starts downward, there are. Typically, after the blow off ends, the price drops all the way down to where the parabolic move (increasing at an increasing rate) began. As far as the speed of the drop relative to the speed of the rise, a fairly good description I heard is “an escalator up & an elevator down” – in other words, it falls quite a bit faster than the rise was. Our speculative answer to the questions, above, are, Yes it is likely that was the end of the blow-off top. Yes, likely other assets will fall in price, following along with it (sooner or later). We point out that Bitcoin had already fallen over 40% over a couple of months before this first huge drop in the price of silver – thus, Bitcoin’s price has been “the leader,” if you will. Also, we think that prices that went up the most are most likely to fall the most. A good example is the price of oil versus the price of Gold. Gold’s price got carried up along with sliver’s (but at a much slower rate); however, oil’s prices went sideways to down during most of the parabolic rise of sliver. Thus, we would expect gold’s price to drop a lot more than oil. As for stocks, we’ve documented so many times how overvalued they are; thus, we would expect them to follow along downwards in price. Ditto, real estate – vastly overvalued. As we have speculated previously, we think the markets will decline similarly to the Financial Crash from 2005/6 down to 2009/12: U.S.Dollar up and pretty much all other general asset prices down in price – of course, they are priced in U.S. Dollars so it is kind of a tautology! No, the U.S. Dollar is/was not doomed as many other commentators have been saying.
1-18-2026 Our Most Recent Tax-Free Performance & The Muni Market – For December, the short term muni market only moved slightly, increasing its performance somewhat. From the chart you can see that for the current twelve months we lagged the category a bit, but, we point out that was with less volatility of the returns. Importantly, even with the lower levels of volatility, we out-performed for all longer time periods.
Stamper Capital & Investments, Inc.
Separately Managed Accounts (National Tax-Free) vs. Tax-Free Municipal Bond Indices
Annual Total Returns, Period Ended 12-31-2025
| PERIOD | Morningstar Muni Short Category Average | SCI Separately Managed Tax-Fee Municipal Accounts Composite Net of Fees | SCI Separately Managed Accounts Net Pre-Tax Equivalent* | Bloomberg Barclay’s 3 Year Tax-Free Muni Bond Index |
|---|---|---|---|---|
| 1 Year | 3.87% | 3.78% | 5.82% | 4.11% |
| 3 Years | 3.42% | 3.55% | 5.46% | 3.20% |
| 5 Years | 1.52% | 2.72% | 4.16% | 1.29% |
| 10 Years | 1.58% | 2.44% | 3.76% | 1.64% |
| 15 Years | 1.61% | 2.26% | 3.48% | 1.70% |
| Since Inception (1/1/1995) | N/A | 3.65% | 5.62% | N/A |
Note: Indices do not have fees (trading costs, custody fees, management fees, etc.) deducted from their returns. We now have a much more reasonable index to compare to – the Bloomberg Barclay’s 3 Year Tax-Free Municipal Index. We still aim for similar or better returns with less risk – The key with this table is that our longer term pre-tax municipal bond returns are noticeably higher than the bond market index but with What We Think is less risk – we will see when rates start to rise and/or credit quality yield spreads widen.
Please see the Disclaimer and Footnotes at the bottom of the page for more information.
* at 35% Federal tax rate
12-18-2025 Our Most Recent Tax-Free Performance & The Muni Market – The short term muni market was a little bit off its pace, resulting in losing a couple of basis points of performance for the current twelve months and we also dropped one basis point compared to the previous rolling 12 month period ending 10-31-2025.
Stamper Capital & Investments, Inc.
Separately Managed Accounts (National Tax-Free) vs. Tax-Free Municipal Bond Indices
Annual Total Returns, Period Ended 11-30-2025
| PERIOD | Morningstar Muni Short Category Average | SCI Separately Managed Tax-Fee Municipal Accounts Composite Net of Fees | SCI Separately Managed Accounts Net Pre-Tax Equivalent* | Bloomberg Barclay’s 3 Year Tax-Free Muni Bond Index |
|---|---|---|---|---|
| 1 Year | 3.45% | 3.81% | 5.87% | 4.11% |
| 3 Years | 3.45% | 3.48% | 5.35% | 3.20% |
| 5 Years | 1.51% | 2.68% | 4.12% | 1.29% |
| 10 Years | 1.57% | 2.42% | 3.73% | 1.64% |
| 15 Years | 1.53% | 2.22% | 3.42% | 1.70% |
| Since Inception (1/1/1995) | N/A | 3.65% | 5.62% | N/A |
Note: Indices do not have fees (trading costs, custody fees, management fees, etc.) deducted from their returns. We now have a much more reasonable index to compare to – the Bloomberg Barclay’s 3 Year Tax-Free Municipal Index. We still aim for similar or better returns with less risk – The key with this table is that our longer term pre-tax municipal bond returns are noticeably higher than the bond market index but with What We Think is less risk – we will see when rates start to rise and/or credit quality yield spreads widen.
Please see the Disclaimer and Footnotes at the bottom of the page for more information.
* at 35% Federal tax rate
12-16-2025 Market Comment – Another Notable Current Just happened. A divergence we have talked about for a while (quite a while actually) has gotten bigger. The divergence is in commodities. It is the divergence between prices of financial commodities and prices of industrial commodities. The price of oil has today just broken below its previous low on 10-20-2025 of $57.52 down to $55.27. As we had been noting the price of oil had been trending down from its high of around $115 back in May 2022 – so for several years and it just broke down more. Oil is now as low as it was in January 2021. One would think that oil’s downward price trend is indicative of a weakening economy.
Oil’s situation is opposite of Gold’s (and Silver’s) whose price had been rising parabolically (rising at an increasing rate) since September 2022. However, the price of gold has stalled from its near vertical rise into what could be described as a double top (but with the second top slightly lower than the first – its current All-Time top). Those Gold price tops are on 10-17-2025 (Gold’s All-Time Top) and a slightly lower top 10-20-2025. Another divergence that we have been pointing out is that between the price of gold and the price of silver. Silver had been lagging gold’s rise until more recently. When gold was at its All-Time High (on 10-20-2025) silver was not; however, since then Silver shot up to its All-Time High on 12-10-2025 (and gold has not). Since then prices of gold and silver have been chopping sideways; however, it looks like Silver will put in a new All-Time High, while gold’s price is still lagging and looks like it will not.
What does all that mean? Very often divergences of prices of similar or related asset classes foreshadow a change in trend of prices. Usually, after some time, the similar asset categories will come back in line with each other. So, will oil catch up to gold and silver or will their prices plummet back down similarly to oil’s? Will gold’s price shoot up to a new All-Time high to align with Silver’s price action or will Silver cool off? What we think is more unlikely, will oil shoot up to a new All-Time high to match Gold and Silver?
Also, we have recent divergences between different stock market sectors. The Dow Jones and the Russell 2000 putting in new All-Time Highs but with the S&P 500 and the NASDAQ lagging, not following that pattern.
There are so many “currents.” One interesting to us is that the prices of Junk Taxable bonds (proxy “JNK”) have mostly been going sideways rather than falling even when we are seeing so much weakness in Commercial Real Estate, in Las Vegas (lots of Junk bond-financed casinos), and in Private Credit. Similarly with prices of High Yield Municipal bonds – Many municipalities have incredible debt loads that are mostly funded by property taxes and sales taxes and we are now seeing/reading about large declines in economic activity in certain geographic locations – specifically, in high end, outlying areas that benefited from the increase in remote work, shooting the prices of real estate upward followed by higher rents and especially higher tourist room rates. Apparently, visitor/tourist rates now have fallen precipitously and lower sales taxes (and property taxes) are an easy speculation. Also, there is now, from what we have read, a huge imbalance between properties listed for sale and demand. Yet with all of that going on, prices of high yield municipal bonds (proxy “HYD”) have hardly dropped, if at all. Importantly, we have observed that in several other large business cycles, prices of Junk Taxable Bonds have been a leading indicator.
Last time (12-3-2025) we mentioned, “…even with the sudden Fed Window borrowing and the history that has surrounded such borrowings & the problems in the shadow banking [(Private Credit)] arena, the KWB Bank Index (“BKX”) has just shot up to an All-Time High!!!” However, even more incredibly, since then Regional Banking ETF (“KRE”) has shot to an All-Time High!!!
It is really amazing to us how prices in some of these categories are seemingly defying the gravity of what is going on in the underlying economy. Almost certainly, some day, it will all start to align. Be careful out there.
12-3-2025 Market Comment – Lots of Interesting Cross Currents have occurred since our previous Market Update.
Bitcoin has dropped around 37% since October 25th (and we expect further lower lows). This drop is huge as it could be the leader in the downcycle as it has been in some smaller cycles (remember Bitcoin has not been around all that long).
Another possible leader in a downcycle is the sudden borrowing at the Fed Window (starting in mid-late November and continuing). Last time this happened similarly, was in late 2019 (which we documented in detail in real time in these pages) and was followed by the “Covid Crash” down into March 2020. Generally, normally, banks make collateralized loans to other banks but when banks do not want to lend to each other, the Fed is the “lender of last resort.” Hmmm…one must ask, “What do they know?” Also, and possibly related to that, recently, there have been issues in the collateralized “shadow bank” lending area, where apparently, collateral was pledged more than once and possibly several times (which would almost certainly be fraud). The result was a bankruptcy. Normally in a bankruptcy, there is recovery amount/percentage, especially it the lending is collateralized, but in this case, recovery is to be zero because the collateral was pledged to multiple lenders.
Incredibly, even with the sudden Fed Window borrowing and the history that has surrounded such borrowings & the problems in the shadow banking arena, the KWB Bank Index (“BKX”) has just shot up to an All-Time High!!!
What we think is another notable divergence is between Gold and Silver. While Silver has just shot up vertically to an All-Time High, Gold has put in a two lower highs – failing to match Silver’s new All-Time High. Divergences between prices of similar assets often mark tops.
We will also cover real estate here. Problems in commercial real estate (CRE) may be why the banks have restricted lending to each other. However, we will focus on residential real estate. Very importantly, sales volumes of residential real estate have continued to decline, even rather dramatically. We think this sales volume decline is important because sales volume declines very often occur before large price declines. And, this situation, in conjunction with average incomes not coming close to supporting average residential real estate prices makes us think the prices could plummet.
One other item, is the U.S. Dollar which is holding up around 99, even though most market pundits expected it to drop. We still believe there will be a flight to the dollar, pushing the U.S. Dollar up and, pretty much everything priced in U.S. Dollars downwards in price.
That brings up another important area – the Japanese Yen carry trade – which is huge – which seems to be unwinding. If it is ending (because Japanese interest rates have been rising rapidly), the borrowers will have to sell assets they purchased with proceeds of borrowing in yen to pay off their yen borrowings. Apparently, trillions of assets in All Kinds of Categories were purchased with proceeds of those borrowings – it is a huge deal. Such sales could push down the prices of such assets, etc. Possibly such selling is the reason bitcoin dropped by 38% since October 25th 2025. The Japanese Yen Carry Trade is so large it may be the best explanation of why we have had this Super Large All-Encompassing Super Bubble – of course, we will only know for sure after the fact and even then it might be debatable.
Not surprisingly, I’m sure, it all looks so precipitous to us. We also have just seen a large drop in payrolls of small businesses. We’d already seen drops in many other cyclical indicators. The divergence between the “real economy” and the financial markets is definitely notable to us.
As we have stated for quite a while, we think the upside potential for prices of most assets is limited but the downside possibility is quite large.
Be careful out there.
11-28-2025 Our Most Recent Tax-Free Performance & The Muni Market – The short term muni market had a reasonable month and a worse month drop off the current twelve months ending 10-31-2025; thus, picking up some performance. We picked up a smaller amount of performance for the period.
Stamper Capital & Investments, Inc.
Separately Managed Accounts (National Tax-Free) vs. Tax-Free Municipal Bond Indices
Annual Total Returns, Period Ended 10-31-2025
| PERIOD | Morningstar Muni Short Category Average | SCI Separately Managed Tax-Fee Municipal Accounts Composite Net of Fees | SCI Separately Managed Accounts Net Pre-Tax Equivalent* | Bloomberg Barclay’s 3 Year Tax-Free Muni Bond Index |
|---|---|---|---|---|
| 1 Year | 3.52% | 3.82% | 5.87% | 3.52% |
| 3 Years | 3.52% | 3.49% | 5.37% | 3.34% |
| 5 Years | 1.53% | 2.62% | 4.03% | 1.25% |
| 10 Years | 1.56% | 2.40% | 3.69% | 1.60% |
| 15 Years | 1.53% | 2.19% | 3.37% | 1.66% |
| Since Inception (1/1/1995) | N/A | 3.65% | 5.62% | N/A |
Note: Indices do not have fees (trading costs, custody fees, management fees, etc.) deducted from their returns. We now have a much more reasonable index to compare to – the Bloomberg Barclay’s 3 Year Tax-Free Municipal Index. We still aim for similar or better returns with less risk – The key with this table is that our longer term pre-tax municipal bond returns are noticeably higher than the bond market index but with What We Think is less risk – we will see when rates start to rise and/or credit quality yield spreads widen.
Please see the Disclaimer and Footnotes at the bottom of the page for more information.
* at 35% Federal tax rate
10-19-2025 Our Most Recent Tax-Free Performance & The Muni Market – The short term muni market had a reasonable month but, for the current twelve months, a “good month” dropped off resulting in about a 50 basis point drop in its annual performance. We dropped only a couple of basis points for the one year; thus, demonstrating our typical lower level of volatility (often considered a measure of risk). Of course, that month did not drop off for the longer terms and the Category moved ahead of us for the current Three years but they did that with considerably more volatility and we are pretty far ahead for the longer periods (see table below).
Stamper Capital & Investments, Inc.
Separately Managed Accounts (National Tax-Free) vs. Tax-Free Municipal Bond Indices
Annual Total Returns, Period Ended 9-30-2025
| PERIOD | Morningstar Muni Short Category Average | SCI Separately Managed Tax-Fee Municipal Accounts Composite Net of Fees | SCI Separately Managed Accounts Net Pre-Tax Equivalent* | Bloomberg Barclay’s 3 Year Tax-Free Muni Bond Index |
|---|---|---|---|---|
| 1 Year | 3.08% | 3.81% | 5.86% | 3.20% |
| 3 Years | 3.76% | 3.45% | 5.31% | 3.75% |
| 5 Years | 1.52% | 2.58% | 3.97% | 1.26% |
| 10 Years | 1.53% | 2.38% | 3.67% | 1.60% |
| 15 Years | 1.45% | 2.18% | 3.36% | 1.62% |
| Since Inception (1/1/1995) | N/A | 3.65% | 5.62% | N/A |
Note: Indices do not have fees (trading costs, custody fees, management fees, etc.) deducted from their returns. We now have a much more reasonable index to compare to – the Bloomberg Barclay’s 3 Year Tax-Free Municipal Index. We still aim for similar or better returns with less risk – The key with this table is that our longer term pre-tax municipal bond returns are noticeably higher than the bond market index but with What We Think is less risk – we will see when rates start to rise and/or credit quality yield spreads widen.
Please see the Disclaimer and Footnotes at the bottom of the page for more information.
* at 35% Federal tax rate
9-21-2025 U.S. Equity Markets – Possible Dow Industrials, S&P 500 and NASDAQ All-Time Tops – Well, you’ve heard that before from us; however, the price movements of these indices, except for the S&P500, is not that far above where they were back in late 2024. Still, given what we are seeing, we point out the possible All-Time Tops on last Friday (9-19-2025) where the S&P topped at a 10x multiple of its 2009 Financial Crash bottom (March 6, 2009). We do not have room to go through all the fundamental news that indicates that the economy is softening; however, some areas are: rising credit card delinquencies, rising auto loan delinquencies, slowing retail sales including slowing fast food sales, the huge change in the real estate markets, not just commercial but also residential with the number of houses for sale up substantially, while the number of sales transactions have plummeted (we believe the trend in sales volumes typically precedes the trend in prices), and so on. Of course, that on top of that are the record debt levels that we’ve reviewed many times in these pages. We so note that a large Auto Lender just filed bankruptcy & that it has tranches of debt sliced & diced similarly to what the mortgage markets had going into the Housing Bubble Top (2005-2007) before the Financial Crash (2007-2010+). And, we believe the tariffs are an anti-stimulus at least in the intermediate term.
Commodities – The divergence between the Financial Commodities and the Industrial Commodities has continued to widen chiefly with Financial Commodities rising notably. Gold put in a new All-Time High and sliver, which can be either financial or industrial and been bounding upwards. Mining stock “GDX” has risen substantially along with them. On the other hand Industrial Commodities Oil and Copper have been moving “choppy sideways” with Copper on a notable horizontal price shelf. The divergence in performance between the two categories is very large. We think it will be resolved one way or another. Because we are expecting the U.S. Dollar to rise in a deflationary wave of pretty much all other prices, we expect Financial Commodities could drop substantially as inflation fears would dissipate quickly.
United States Dollar – had been chopping sideways to upwards but turned to chopping sideways to downwards and put in a new lower low concurrent with the rising prices in financial commodities and the rise in the prices of largest equity stocks (and their indicies). Being the “Value Contrarians” we are, we are comfortable being in the minuscule minority that is expecting the U.S. Dollar to put in a low here, likely concurrent with big stocks’ All-Time High (last Friday). If we are correct, then we expect Commodities will also be dropping in price with financial commodities likely catching up on the downside with industrial commodities.
We have been documenting the Roundness of the huge Equity top. Equity prices generally do not “free fall” from tops – crashes in equities are usually a month to a few months later (before chopping up again, in very sharp counter-trend rallies as we have documented so many times over the years). But given the very poor underlying economic fundamentals and a possible associated move up in the U.S. dollar nothing should be taken for granted. Also, importantly, commodities can and often do “drop from the top” which would just add more fuel to the fire – sigh.
Of course, this is all speculative – so we will see. However, to us, the upside is minimal in those asset categories we highlighted above and we see the downside as substantial. Be careful out there.
9-16-2025 Our Most Recent Tax-Free Performance & The Muni Market – The short term muni market had a reasonable month but it had very poor months drop off both the current twelve months and the current three years, thus; notably improving its performance for those two periods; however, with its longer term performances pretty much unchanged. We did not have any performance near that poor drop off of either period and lost a bit of relative and absolute performance for the current twelve months with a loss of relative performance but an increase in absolute performance for the current three years. These differences in performance demonstrate the relative stability of our returns compared to the category average. Even with less measured volatility risk, we have outperformed for most periods.
Stamper Capital & Investments, Inc.
Separately Managed Accounts (National Tax-Free) vs. Tax-Free Municipal Bond Indices
Annual Total Returns, Period Ended 8-31-2025
| PERIOD | Morningstar Muni Short Category Average | SCI Separately Managed Tax-Fee Municipal Accounts Composite Net of Fees | SCI Separately Managed Accounts Net Pre-Tax Equivalent* | Bloomberg Barclay’s 3 Year Tax-Free Muni Bond Index |
|---|---|---|---|---|
| 1 Year | 3.45% | 3.83% | 5.89% | 3.89% |
| 3 Years | 3.50% | 3.34% | 5.14% | 3.45% |
| 5 Years | 1.58% | 2.54% | 3.91% | 1.37% |
| 10 Years | 1.60% | 2.36% | 3.63% | 1.68% |
| 15 Years | 1.48% | 2.16% | 3.33% | 1.65% |
| Since Inception (1/1/1995) | N/A | 3.65% | 5.62% | N/A |
Note: Indices do not have fees (trading costs, custody fees, management fees, etc.) deducted from their returns. We now have a much more reasonable index to compare to – the Bloomberg Barclay’s 3 Year Tax-Free Municipal Index. We still aim for similar or better returns with less risk – The key with this table is that our longer term pre-tax municipal bond returns are noticeably higher than the bond market index but with What We Think is less risk – we will see when rates start to rise and/or credit quality yield spreads widen.
Please see the Disclaimer and Footnotes at the bottom of the page for more information.
* at 35% Federal tax rate
8-31-2025 U.S. Equity Markets – Scraping the Ceiling Continues – Similar to the past month or so, the Big Three (Dow Jones Industrials, S&P500 and NASDAQ) continue to move along the level of their previous All-Time Highs. Last week, the S&P500 put in another slight All-Time High but the Dow Industrials and the NASDAQ did not.
Tariffs – A court has ruled that many of “Trump’s Tariffs” are unlawful. Of course, this will be challenged in yet another court; however, it, again, increases the level of uncertainty for the markets but, more so, for those trying to conduct business. Apparently, the tariffs will continue in place until another court ruling. Some speculate that ending those tariffs would send the equity markets up as business revenues & margins would increase. However, I suspect that a bigger issue would come from the bond market which would likely trade off due to concerns about inflation as the Tariff Tax Revenues would decline and the budget deficit would go up. In addition, of course, as we think we are near the end of a huge bubble top, any increase in uncertainty could unleash the first domino for The Big Three Indices (other indices are notably still below their All-Time Tops and have been for quite a long time.) Of course, we will see.
8-24-2025 U.S. Equity Markets – It Flipped -More Divergences but The Other Way Around – On Friday, 8-22-2025 Fed. Chair Powell discussed interest rates and stated that the Fed “may” cut its short term lending rate. Of course, below, we had stated, “During the current month (July 2025 [to 8-16-2025]) while one month Treasury yields remained essentially unchanged, the three and six months yields dropped by around 20 basis points, which is a notable move, and may or may not be enough for the Federal Reserve to lower their lending rate.” So, while the Governor’s discussion was what we expected, the stock market reacted to it somewhat euphorically, especially for the Dow Jone Industrial Average, which had been lagging with its last All-Time High back in November 2024, shot up to a new All-Time High. This was a large move of bout 1.89%. However, the S&P 500 and the NASDAQ missed, with the NASDAQ somewhat lower from its high than the S&P. And, of course, essentially all other equity indices are far below their’s. Still, who knows with this level of irrationality!?! Junk Bonds (“JNK” ETF) also shot up to its highest level since October 2024. Interestingly, High Yield Municipal Bonds (“HTD” ETF) also spiked on the day but are clearly in a downtrend and seem, remarkably, to be the leader in the cycle (assuming the Dow, S&P and NASDAQ) join the rest of the market in a down cycle). We point out that most of the other markets (commodities, bitcoin, etc.) were subdued – they were not affected by the ambiguous interest rate talk – which could mean it was just a technical rebound in stocks, as large as it was. Well, to us, all the dominoes are in place (but they have been for quite a while). Of course, we will see. Be safe out there.
8-20-2025 U.S. Equity Markets – More divergences and The Final Tops for the Remaining Two? Last week we got a few new All-Time Highs in the NASDAQ and one in the S&P500. On the first one, the NASDAQ stuck out all by itself with the S&P 500 just missing and the Dow Jones Industrials far behind (and everything else far behind that). Then, the NASDQA put in yet another All-Time High and the S&P 500 joined with its own. Remarkably the Dow Industrials shot up a lot, almost catching up but, it just missed putting in an All-Time High yet again – its All-Time High is 12-24-2024 just slighly higher than it is eight months later.
IMPORTANTLY to us, since these tops (August 13th and 14th 2025) we now have potential downlegs in all major indices including those from All-Time Tops – NASDAQ and the S&P500 and from the rest resuming their downtrends from lower levels – The Dow Industrials – and much lower levels, the Dow Transports, the Russell 2000, etc. (we didn’t check them all). Also, downtrends from All-Time Highs in Bitcoin (8-13-2025) and in Gold (8-8-2025). So, this move, although very small so far, is pervasive.
Will that pervasive drop continue? – that is the question. As we’ve documented time & again over the cycles of the past 30 years, tops in the equity market tend to be “broad” with divergences (in time – peaks) and that is what we are seeing. Also, of course, the fundamentals as we’ve documented are, to us very weak. The amount of financing and debt is off the charts high. We believe that at some time, essentially all the markets will be falling in price similar to during The Financial Crash (from 2008 down into 2009 to 2012 depending upon the particular markets) and that the conditions look to us to make it very possible, even likely, that the final turns have just passed. Ok, we stuck our neck out again. Of course, we will be watching. Be careful out there.
8-16-2025 Our Most Recent Tax-Free Performance & The Muni Market – The short term muni market had a reasonable month but it had a better month drop off the current 12 month period, thus losing about 20 basis points. Our total return for the current 12 months, remarkably, remained rock solid at an unchanged 3.95% (tax-free). During the current month (July 2025) while one month Treasury yields remained essentially unchanged, the three and six months yields dropped by around 20 basis points, which is a notable move, and may or may not be enough for the Federal Reserve to lower their lending rate.
Stamper Capital & Investments, Inc.
Separately Managed Accounts (National Tax-Free) vs. Tax-Free Municipal Bond Indices
Annual Total Returns, Period Ended 7-31-2025
| PERIOD | Morningstar Muni Short Category Average | SCI Separately Managed Tax-Fee Municipal Accounts Composite Net of Fees | SCI Separately Managed Accounts Net Pre-Tax Equivalent* | Bloomberg Barclay’s 3 Year Tax-Free Muni Bond Index |
|---|---|---|---|---|
| 1 Year | 3.18% | 3.95% | 6.07% | 3.98% |
| 3 Years | 2.61% | 3.30% | 5.07% | 2.42% |
| 5 Years | 1.32% | 2.53% | 3.90% | 1.13% |
| 10 Years | 1.45% | 2.36% | 3.63% | 1.52% |
| 15 Years | 1.41% | 2.17% | 3.33% | 1.58% |
| Since Inception (1/1/1995) | N/A | 3.65% | 5.62% | N/A |
Note: Indices do not have fees (trading costs, custody fees, management fees, etc.) deducted from their returns. We now have a much more reasonable index to compare to – the Bloomberg Barclay’s 3 Year Tax-Free Municipal Index. We still aim for similar or better returns with less risk – The key with this table is that our longer term pre-tax municipal bond returns are noticeably higher than the bond market index but with What We Think is less risk – we will see when rates start to rise and/or credit quality yield spreads widen.
Please see the Disclaimer and Footnotes at the bottom of the page for more information.
* at 35% Federal tax rate
7-31-2025 Another Indicator of “The Top?” – All-Time for the big equities and a Resumption of their downtrends for the rest. Today, the NASDAQ shot up to another All-Time High but “Inter-day” as it reversed and closed lower than the previous day’s close. The S&P500 did the same thing – made an “Inter-day” All-Time High but closed lower for the day’s close. The Dow Industrials pretty much just dropped during the day (closed down over 300 points) as did pretty much the rest of the equity market. The Failure of the S&P500 and the NASDAQ to maintain those “Inter-day” All-Time Highs could very well be another indication that the top of the SUPER ALL EVERYTHING BUBBLE is “in.” It likely shows an exhaustion of the trend for the several remaining stocks that had been pulling up the big indices; all the rest had been peeling off to the downside. We will see if they all go down together now.
7-30-2025 There you go – Fed leaves rates unchanged today, as we speculated they would, below.
& The BIG TECH EQUITY ALL-TIME TOP is IN? Also, the Dow Jones Industrials has continued to NOT put in a new All-Time High even though it got within 10 points. As we discussed that possibility happening (below), we think that “MISS” is very telling – to get so close and to fail. And, it looks to us that a downturn in equity prices from All-Time Highs has Started for the S&P 500 and the NASDAQ, and Resumed for pretty much all other equity indicies, with the All-Time high for the S&P500 and NASDAQ on 7-29-2025 and the Dow Industrials associated high (All-Time Ever-So-Close Miss) on 7-23-2025. Of course, this forecast is highly speculative as, in the scheme of things, so far declines are just miniature blips and amount of time has been exceedingly short – just a day or days. We note: the Dow Industrial’s All-Time High is still way back on 11-24-2024 – essentially sideways since then with a big dip and rebound in the middle. Other than the S&P500 and the NASDAQ, which are quite a bit higher than their November 2024 levels, essentially all other indices are noticeably down from late 2024.
Also, we note that Copper fell a whopping 17% today. “Traders were stunned when copper cathodes, the most widely imported and traded form of refined copper, were exempted from the new [50% Tariff] duties, triggering a vicious unwinding of bullish bets. The initial expectation had been that the tariffs would apply to all refined imports.” “[Today, the White House announced a 50% tariff on all semi-finished copper imports starting August 1.”
7-22-2025 The Markets – As forecasted, the S&P500 and the NASDAQ put in new All-Time highs since our last Update and are now about 3% to 4% above their previous ones. Also, as forecasted, the Dow Jones Industrial has NOT taken out its previous All-Time high, and essentially all other domestic equity indices are further behind. However, as we mentioned previously, when large indices get close to a new high, they usually attain it & the Dow Jones Industrial Average is now very close. Thus, we would not be surprised to see the Industrials put in a new All-Time High shortly. We point out the the Dow Jones Industrial FUTURES CONTRACT was even closer to eclipsing its 12-4-2024 All-Time High on July 3rd and 4th, 2025 but just missed. Still, as reviewed previously, we have already had a few “New All-Time High” misses during this current Super Bubble Cycle Top which highlights how broad it is. If the Dow doesn’t make it this time, that would be “telling.” Maybe the Futures does and the Cash Market does not. Of course, we will see – be careful out there – there is so much risk in the markets right now.
Bond Markets – The yield of the U.S. 30 year long bond continues to cycle above and blew the 5% level. At the same time the “belly” of the short end of the curve has rallied a bit (yields down) so we are getting a bit of a steepening but we believe we have quite a ways to go and that most of the resolution to a more normal shaped yield curve will be accomplished by the long end trading off (yields going upwards). If that happens, it will almost certainly wreak havoc prices of all heavily financed asset categories – stocks, real estate, commodities, etc. We are already seeing problems in the real estate market in certain states like Florida, Texas and Arizona. Importantly, sales volumes of residential real estate across the U.S. have plummeted to 2010 (market bottom levels) even while reported median prices across the country have held up. As reviewed previously, typically, sales volumes lead prices so get ready to hold onto your hat. One other item of note in the bond market is the rise in yields in Japan at the short end of their yield curve; it is very similar to what happened in the U.S. not to long ago when our short term yields rose from near zero to around 5%. Rising rates abroad would very likely be a catalyst for rising rates in the U.S. Also, since the short end of our yield curve has not fallen much, we don’t expect the Federal Reserve to lower their rate over the next month.
7-18-2025 Our Most Recent Tax-Free Performance & The Muni Market – The short term muni market had another good month but had a better month drop off of the current twelve month total returns. Still, results have been quite respectable. Our lead has continued as you can see in the chart below and we’ve accomplished it with less risk (measured volatility).
Stamper Capital & Investments, Inc.
Separately Managed Accounts (National Tax-Free) vs. Tax-Free Municipal Bond Indices
Annual Total Returns, Period Ended 6-30-2025
| PERIOD | Morningstar Muni Short Category Average | SCI Separately Managed Tax-Fee Municipal Accounts Composite Net of Fees | SCI Separately Managed Accounts Net Pre-Tax Equivalent* | Bloomberg Barclay’s 3 Year Tax-Free Muni Bond Index |
|---|---|---|---|---|
| 1 Year | 3.42% | 3.95% | 6.07% | 4.08% |
| 3 Years | 2.79% | 3.20% | 4.92% | 2.55% |
| 5 Years | 1.36% | 2.58% | 3.97% | 1.10% |
| 10 Years | 1.43% | 2.35% | 3.61% | 1.52% |
| 15 Years | 1.44% | 2.19% | 3.36% | 1.58% |
| Since Inception (1/1/1995) | N/A | 3.65% | 5.62% | N/A |
Note: Indices do not have fees (trading costs, custody fees, management fees, etc.) deducted from their returns. We now have a much more reasonable index to compare to – the Bloomberg Barclay’s 3 Year Tax-Free Municipal Index. We still aim for similar or better returns with less risk – The key with this table is that our longer term pre-tax municipal bond returns are noticeably higher than the bond market index but with What We Think is less risk – we will see when rates start to rise and/or credit quality yield spreads widen.
Please see the Disclaimer and Footnotes at the bottom of the page for more information.
* at 35% Federal tax rate
6-23-2025 The Markets – The Equity Markets have continued their retracements of their large drops documented below. The S&P 500 and the NASDAQ have recouped the most by far with the Dow Jones Industrials lagging and all the other indices still further behind. However, usually when Indicies get that close to making new high, they do. Although we saw in the late 2024 and early 2025 divergences (documented below) that this is not always the case. We expect these divergences to continue. From this point, our expectation is a slight new All-Time High by the S&P 500 shortly and likely by the NASDAQ. However, we think it is much less likely for the Dow Industrials and not likely at all for others like the Russell 2000 and the Transports, etc. Thus, the “Big Round Super Top” that we’ve been forecasting & documenting will become even broader in terms of time and shape, which, of course, is appropriate for the largest stock market top in history. What happens after that could be “very interesting.” We see see many fundamental signs that the economy is slowing. Also, we see that prices are actually dropping in some areas like in real estate and also dramatically in used goods that we follow – it seems there is a glut. Of course, that is the opposite in what we have just seen in prices of gold and silver. So, while the underlying economy seems to be weak and weakening, the markets are, or rather, have been “cresting” for quite a while. After the Crest, comes the drop. We still believe the tariffs are deflationary and we are just starting to see their impacts. Then there are the wars. There is a lot going on. As for bonds, as forecasted, the yield curve has been steepening but more with the shorter end dropping, a bit but not enough for the Fed to cut rates, so far. We continue to expect long rates to rise further and the impact of rising longer term rates to put downward pressure on prices of highly leveraged assets. Of course, we will see.
6-18-2025 Our Most Recent Tax-Free Performance & The Muni Market – The short term muni market had another good month bringing the current twelve month returns ending 5-31-2025 up to very respectable levels. We like to point out that our return was achieved with less volatility. This can best be seen by looking at the variability of the longer term performances (in the table below), especially for the 5 Years, 10 Years, and 15 Years periods.
Stamper Capital & Investments, Inc.
Separately Managed Accounts (National Tax-Free) vs. Tax-Free Municipal Bond Indices
Annual Total Returns, Period Ended 5-31-2025
| PERIOD | Morningstar Muni Short Category Average | SCI Separately Managed Tax-Fee Municipal Accounts Composite Net of Fees | SCI Separately Managed Accounts Net Pre-Tax Equivalent* | Bloomberg Barclay’s 3 Year Tax-Free Muni Bond Index |
|---|---|---|---|---|
| 1 Year | 3.59% | 4.01% | 6.16% | 4.16% |
| 3 Years | 2.46% | 3.15% | 4.85% | 2.27% |
| 5 Years | 1.32% | 2.56% | 3.94% | 0.99% |
| 10 Years | 1.37% | 2.33% | 3.58% | 1.47% |
| 15 Years | 1.40% | 2.18% | 3.35% | 1.56% |
| Since Inception (1/1/1995) | N/A | 3.65% | 5.62% | N/A |
Note: Indices do not have fees (trading costs, custody fees, management fees, etc.) deducted from their returns. We now have a much more reasonable index to compare to – the Bloomberg Barclay’s 3 Year Tax-Free Municipal Index. We still aim for similar or better returns with less risk – The key with this table is that our longer term pre-tax municipal bond returns are noticeably higher than the bond market index but with What We Think is less risk – we will see when rates start to rise and/or credit quality yield spreads widen.
Please see the Disclaimer and Footnotes at the bottom of the page for more information.
* at 35% Federal tax rate
5-18-2025 Our Most Recent Tax-Free Performance & The Muni Market – The short term muni market had a nice improvement for the current month so did we. While we both gained, the average gained an extra 7 relative basis points for the current twelve months; however, our lead in all periods below is very strong.
Stamper Capital & Investments, Inc.
Separately Managed Accounts (National Tax-Free) vs. Tax-Free Municipal Bond Indices
Annual Total Returns, Period Ended 4-30-2025
| PERIOD | Morningstar Muni Short Category Average | SCI Separately Managed Tax-Fee Municipal Accounts Composite Net of Fees | SCI Separately Managed Accounts Net Pre-Tax Equivalent* | Bloomberg Barclay’s 3 Year Tax-Free Muni Bond Index |
|---|---|---|---|---|
| 1 Year | 3.15% | 3.99% | 6.14% | 3.36% |
| 3 Years | 2.53% | 3.06% | 4.71% | 2.44% |
| 5 Years | 1.52% | 2.49% | 3.83% | 1.24% |
| 10 Years | 1.28% | 2.31% | 3.55% | 1.38% |
| 15 Years | 1.39% | 2.18% | 3.35% | 1.54% |
| Since Inception (1/1/1995) | N/A | 3.65% | 5.62% | N/A |
Note: Indices do not have fees (trading costs, custody fees, management fees, etc.) deducted from their returns. We now have a much more reasonable index to compare to – the Bloomberg Barclay’s 3 Year Tax-Free Municipal Index. We still aim for similar or better returns with less risk – The key with this table is that our longer term pre-tax municipal bond returns are noticeably higher than the bond market index but with What We Think is less risk – we will see when rates start to rise and/or credit quality yield spreads widen.
Please see the Disclaimer and Footnotes at the bottom of the page for more information.
* at 35% Federal tax rate
4-13-2025 The Markets – “It’s The Bond Market – silly!” As you know, we’ve been forecasting yields of longer bonds to resume their upward rise across the yield curve to steepen it. And, that is what has been happening. In fact, the yields of the U.S. Treasury 30 Year Long Bond and the Ten Year both rose by around 40 basis points last week. There is a lot of chatter about the size and quickness of those rises. It is important because so many interest rates are “based” (“priced”) off of the U.S. Ten Year. In fact, there is a lot of concern, that is probably justified, that rising interest rates are/will cause some more “sophisticated” investment schemes to blow up and have to be liquidated. That situation could very well be the impetus of the recent huge downside price volatility in the the stock market.
Importantly, the short end of the Yield Curve is mostly unchanged, so we are getting the steeper yield curve we have been forecasting – resulting from higher long term yields, not from lower short term yields, which was part of our forecast (see previous days’ commentaries). It is important to us, because rising longer term yields normally means investors are not currently concerned about inflation. If inflation is a primary concern, the yield curve would be “inverting” with shorter yields higher than longer term yields – that is not what is happening. Thus, the continued steepening of the yield curve goes along with our disinflation/deflation forecast. Actually, we think we may be just beginning to see a “GREAT UNWINDING” as interest rates rise to reflect notable increases in perceived risk. Rising interest rates will push down prices of pretty much everything (see below) which could force asset liquidations, which would push prices down even further – kind of a self-reinforcing cycle, unfortunately.
Disinflation/Deflation – Stocks & Commodities – In addition, rising interest rates normally will take a toll on assets positions that are heavily financed (unless we are in an inflation). We have been reporting on the continuing downtrend in prices in various sectors – Industrial Commodities like oil, used consumer goods on Ebay and Craigslist, Industrial-Financial commodity silver, etc. Importantly, the rises in interest rates generally correlate with falling stock prices (and falling housing prices). In fact, both the equity markets and the bond market have just experienced very large levels of volatility: net down for stocks and bonds and up for interest rates. Prices of Industrial Commodities have also dropped notably.
Gold – Gold, “The” Financial Commodity, has been in a parabolic uptrend that started in 2016 at around $1,000 per ounce. Its rise has been increasing at an increasing rate and is now almost vertical. We’ve reported on similar parabolic rises and collapses in various asset classes several times in these pages over the many years. One we did not report on was Gold’s previous parabolic rise from $300 in 2001 up to $1900 in 2011. Note, that rise is not as steep as the current rise. We normally see that once a parabolic near-vertical rise is over, the asset’s price drops all the way back to the beginning of the rise. However, in this case it dropped only back down to $1,100 in 2016 – still a significant drop. That level could be seen as the beginning of the current parabolic rise but it has a “continuity break” in its rise from then with the other potential starting point being $1,600 in 2023. So, with the bond market signaling “Deflation” and gold in the near-vertical portion of a parabolic rise, we are looking for Gold to top and drop significantly, down towards the 2023 low/starting point, if not lower. And, there is another piece to this picture (see below).
U.S. Dollar – And, we see another piece to this picture, which involves not only Gold, but other Commodities, and Stocks, and Real Estate, and longer term Bonds – and that is the U.S. Dollar. Lots of people are very concerned about the U.S. Dollar and we are too but, we believe that if we are going into a “deflation,” the U.S. Dollar will by definition go up in value, at least with respect to prices in the U.S. Yes the U.S. Dollar has been heading downwards sharply just as Gold has been heading up nearly vertically. But, we believe these directions will change abruptly with U.S. Interest Rates rising. Thus, we are expecting the U.S. Dollar to begin a notable rise – accordingly, essentially everything priced in dollars (at least domestically) will be falling in price. This is the situation we forecast and what happened for the Financial Crash (2007-2008) down from the Housing Bubble Top (2005-2007). Similarly, we expect the prices of real estate will be dropping.
Looking Forward – If we are correct with the several related forecasts above, we expect large moves and volatility in all markets – U.S. Dollar up along with rising interest rates and with prices of pretty much everything else dropping – the more leverage/debt/derivatives/futures/”Basis Trades”, etc. in an asset class, the more the prices will likely drop as they are unwound, sold, etc. It seems we are in the grip of lots of market turmoil; we expect it will continue for some time. Bear Markets typically last for several years and sometimes much longer, unfortunately.
4-13-2025 Our Most Recent Tax-Free Performance & The Muni Market – The short term muni market lost a bit for the current month while we added a bit. Bottom line is that we improved for the current twelve months while the Short Term Muni Average dropped off a bit. Looking forward, given the turmoil in the equity markets, we expect high yield (i.e. riskier with respect to credit quality) muni’s will have a tougher “go” going forward. Of course, we will see. Similarly, we expect longer duration (generally longer maturity) muni’s will also have a tough time. Again, we will see.
Stamper Capital & Investments, Inc.
Separately Managed Accounts (National Tax-Free) vs. Tax-Free Municipal Bond Indices
Annual Total Returns, Period Ended 3-31-2025
| PERIOD | Morningstar Muni Short Category Average | SCI Separately Managed Tax-Fee Municipal Accounts Composite Net of Fees | SCI Separately Managed Accounts Net Pre-Tax Equivalent* | Bloomberg Barclay’s 3 Year Tax-Free Muni Bond Index |
|---|---|---|---|---|
| 1 Year | 3.06% | 3.95% | 6.08% | 3.36% |
| 3 Years | 2.26% | 3.03% | 4.66% | 2.23% |
| 5 Years | 1.50% | 2.49% | 3.83% | 1.34% |
| 10 Years | 1.30% | 2.30% | 3.54% | 1.42% |
| 15 Years | 1.43% | 2.19% | 3.36% | 1.60% |
| Since Inception (1/1/1995) | N/A | 3.65% | 5.62% | N/A |
Note: Indices do not have fees (trading costs, custody fees, management fees, etc.) deducted from their returns. We now have a much more reasonable index to compare to – the Bloomberg Barclay’s 3 Year Tax-Free Municipal Index. We still aim for similar or better returns with less risk – The key with this table is that our longer term pre-tax municipal bond returns are noticeably higher than the bond market index but with What We Think is less risk – we will see when rates start to rise and/or credit quality yield spreads widen.
Please see the Disclaimer and Footnotes at the bottom of the page for more information.
* at 35% Federal tax rate
4-8-2025 The Equity Markets – Whoa, as forecast, the “huge volatility has continued” although the net progress has been muted because the volatility was Up and Down with a good portion of it hidden in “intra-day” moves. For example, in the Dow Jones Industrial Average, on 4-7-2025 (Monday), opened at around 37,060 (Friday’s Close) and quickly shot up around 1,640 points to around 38,700 (the high for the day) on a Trade Rumor! that was then discredited resulting in a drop of about half of that gain. After a few large gyrations it closed at around 38,000 for the day’s net rise of 940 points but still 700 points below the day’s high. We note that the 1,640 largest “intra-day” rise was a 31% retracement of the drop from the intermediate high of 42,380 (or so) on 4-2-2025 to the day’s low. Of course, it was a smaller percentage from the higher intermediate top before/above that of around 42,757 on 2-25-2025 and the essentially double top of 44,960 on 1-25-2025 and the ever so slightly higher All-Time Top at about 54,030 on 12-24-2024. However, we believe that retracement should be considered in conjunction with the lowest of those highs that we used.
Then on the next day (today, Tuesday) we saw similar volatility. The Industrials starting from the previous close of around 38,000 shot up by 1,400 points to the day’s high of 39,400 on more Trade Information but then, additional “Trade Sparing” shot the Industrials down by approx. a whopping 2,285 points to the day’s low of 37,115. It then rebounded by 530 points to close at about 37,645. The day’s net was a drop of about 355 points. While that 1,400 counter-trend rally was very large it was dwarfed by the immediately following drop of 2,285 points, mitigated somewhat by the 530 point rise into the day’s close.
We see this level of Huge Up and Down Volatility as a likely “confirmation” we are in a Bear Market and we expect it to continue. Ultimately, we expect further NET large drops as detailed below, unfortunately. The Drops should be ultimately 2 to 3 times larger than the rises – something like that. Maybe a couple more large net drops (with similar intra-day counter-trend moves to what we just saw) before we have a GIANT counter-trend rally/retracement like we detailed below with respect to “The Tech Wreck” and “The Financial Crash,” from dramatically lower lows. We expect violent rises and drops will be fueled by rumors, announced negotiations, etc. and associated short covering and people trying to buy the bottom. We believe it will likely be very tough market conditions for most.
4-6-2025 (Sunday) The Equity Markets – The Crash – Last Time (on 3-23-2025) we said, “We expect some more choppy rebounding and then a turn down to substantially lower lows,” and that is essentially what happened: we saw a choppy rebound for a couple of days and then the markets turned down hard to substantially lower lows. The headlines are calling it a “crash” and that is what it is. In the resumption of the downtrend on the Dow Jones Industrial Average, it first put in a bit of a low followed by a slight rebound and then fell by almost 9.5% to a closing low two days later on Friday, 4-4-2025. This drop brought the Dow Jones Industrials “Drop from the Top” to down 14.9% or down by about 6,700 points. The S&P has similarly negative numbers. From their All-Time Highs, the Russell 2000 is now down about 26% and the NASDAQ is down 22.7% – so both officially in “Bear Markets.” Note: that these markets saw their All-Time-Top spread out at different times (see Previous Discussions); some just by a hair and that points out that this is a big round/flat top as we’ve discussed many times. Importantly, we believe The Tops Are In – wow, this has been a Huge Top! and in so many asset classes: Stocks, Bonds (a few years ago), Real Estate, some commodities (Gold).
Also, as we’ve forecasted, the Industrial Commodities also went down. Oil dropped 14% over the past two days. Silver, kind of a hybrid Industrial-Financial Commodity also dropped 16%. Gold however, held up better dropping only a bit under 5%. We expect Industrial Commodities to follow along with stocks. Gold is a bit of a different animal but we definitely would not bet the ranch that it is going to rise while we are in an Overall Deflation, which is what we are forecasting.
Looking forward, with respect to Equities, we believe this current decline is only about half over. So the Dow Industrials are currently down 14.9% or by 6,700 points. Thus, while we do expect some sharp & choppy rebounds, we don’t expect a Huge counter-trend rebound (see below) in stocks until we are thousands of points and a number of percentage points lower. A rough guess would be the Down would drop by up to another 14.9% or so – maybe up to 6,000 or so more points down – Then, we would see a Huge Counter -Trend Rebound like I talked about directly below. Of course, subject to change in these super fast markets as conditions change. We forecast that the recent huge volatility will continue. “Safety” should likely be emphasized for most “investors” over trying to make big profits. Actually, when markets are so far above “fair value,” we like to call it “speculating/speculators” – and, we think it has been in “Speculation” mode for many years now. The dominoes have been in place for a long time; it was only a matter of time before something would finally trigger a huge decline. Also, typically, Bear Market declines go below “Fair Market Value,” often by a considerable amount, just as this “Bull Market” had “bubbled” above “Fair Market Value,” by a considerable amount.
BEAR MARKET COUNTER-TREND RALLIES – I just copied what we wrote in our February 8, 2014 Update as we think it is still valid (so, here, we are quoting ourselves in 2014 quoting ourselves in 2008). The important idea is that we expect there will be some very large counter-trend rallies in the context of our forecast for the Huge Downtrends overall. Here it is:
“Here is come commentary Here is some commentary from our 2008 Annual Forecast (dated 1-24-2008) – we were looking at what we saw in the drop from the 2000 top to anticipate what we expected was going to occur from 2007 top:
We looked at the drops in equities from the 2000 top to the 2002 bottoms [The Tech Wreck] focusing on the percent rise of retracements of intermediate drops during the overall downtrends. Here is what we found:
………………………………….First Second Third Total
………………………………….Retracement Retracement Retracement Drop
Dow Jones Industrials 76% 76% 50% 38%
S&P 500 50% 62% 38% 49%
NASDAQ 50% 24% 62% 78%
Thus, even though there were huge retracements of large drops, at the end of the period (in late 2002), the DOW bottomed down 38%, the S&P bottomed down 49% and the NASDAQ bottomed down a whopping 78%. In that light we expect large counter-trend retracement rallies similar to those experienced during the drop from the 2000 top. However, given the poorer fundamentals at this time than even at the 2000 top, we are forecasting smaller retracements – probably more like 24% as opposed to 50% or 76%.
Still, it will be tough to not think the downturn is over when it is simply a large counter-trend rally. Of course, if the stock market is dropping precipitously, real estate will be falling hard and low quality bonds will be seeing their interest rates rise (prices drop) rather dramatically. We think the recession will last throughout 2008. We will forecast 2009 next January.
And, our forecast was pretty much right on, especially compared to the financial media and most financial commentators. Here is what happened from the 2007 top down to the 2009 bottom [The Financial Crash]:
………………………………….First Second Third Fourth Total
………………………………….Retracement Retracement Retracement Retracement Drop
Dow Jones Industrials 76% 62% 38% 38% 54%
S&P 500 76% 60% 50% 38% 57%
NASDAQ 60% 65% 76% 30% 55%
Russell 2000 91% 62% 76% 36% 60%
You can see the retracements were a bit smaller than from the 2000 top (quote above) although there were more of them and the overall drops were larger. We added the Russell 2000; you can see that it has even bigger retracements but ultimately lost the most!
We expect those same types of large counter-trend retracement rallies to occur during this major decline. Just like the previous two times, they should be big enough to allow “reasonable” people to believe that the downturn is over.”
3-23-2025 The Equity Markets – We have had pretty much a repeat of the divergences we reviewed on 1-31-2025 except that we Now have had more notable declines including from the one indice with a new All-Time Top. Thus, the size of “The Top” has widened even more in time and ever so slightly in price as the new All-Time Top is incredibly close to the previous ones (as are some of the “misses” for a couple other indices – It looks to be a huge flat top.
First, some returns of those that had All-Time Tops back on 11-25-2024 and recent bottoms on 3-13-2025: Dow Jones Transports down 19%; S&P Small Cap (“IJR” proxy) down 19.5%, Russell 2000 down 18.5%. Note “Down 20%” is considered a “Bear Market” so we are close in those indices. Then, the Dow Jones Industrial Average with its All-Time Top still back on 12-4-20-24 and a drop to its recent low on 3-13-2025 of 8.7%. Then, the NASDAQ Comp and Future (“NDQ”) both still have All-Time Tops a little later, on 12-16-2024, and recent bottoms on 3-13-2025 with drops of 14%. Now the one (same as last time) with new All-Time Top – the S&P 500 on 2-19-2025 with a recent bottom on 3-13-2025 and a “drop from the top” of 10.3%. Note “Down 10%” is considered a “Correction.”
Since all those bottoms on 3-13-2025, we have had fairly choppy mostly sideways rebounds in all indices. Of course, the question is, “Are the tops in or are we going to do this again?” Of course, we do not know but given all that we’ve reviewed previously over the years and recently, we think there is a high probability that “The Tops are In” especially those that topped longer ago and have dropped more, and that the upside potential is not adequate for the downside probability. We expect some more choppy rebounding and then a turn down to substantially lower lows.
3-17-2025 Our Most Recent Tax-Free Performance & The Muni Market – The short term muni market rebounded a bit more for the current month resulting in a increase in performance. Our return also rebounded, but less; however, our return started quite a bit higher and we maintained that lead for the current twelve months and much more so for the longer periods (see table, below).
Stamper Capital & Investments, Inc.
Separately Managed Accounts (National Tax-Free) vs. Tax-Free Municipal Bond Indices
Annual Total Returns, Period Ended 2-28-2025
| PERIOD | Morningstar Muni Short Category Average | SCI Separately Managed Tax-Fee Municipal Accounts Composite Net of Fees | SCI Separately Managed Accounts Net Pre-Tax Equivalent* | Bloomberg Barclay’s 3 Year Tax-Free Muni Bond Index |
|---|---|---|---|---|
| 1 Year | 3.41% | 3.82% | 5.88% | 3.31% |
| 3 Years | 1.91% | 2.95% | 4.54% | 1.70% |
| 5 Years | 1.19% | 2.45% | 3.78% | 1.09% |
| 10 Years | 1.33% | 2.28% | 3.50% | 1.43% |
| 15 Years | 1.43% | 2.20% | 3.39% | 1.57% |
| Since Inception (1/1/1995) | N/A | 3.65% | 5.62% | N/A |
Note: Indices do not have fees (trading costs, custody fees, management fees, etc.) deducted from their returns. We now have a much more reasonable index to compare to – the Bloomberg Barclay’s 3 Year Tax-Free Municipal Index. We still aim for similar or better returns with less risk – The key with this table is that our longer term pre-tax municipal bond returns are noticeably higher than the bond market index but with What We Think is less risk – we will see when rates start to rise and/or credit quality yield spreads widen.
Please see the Disclaimer and Footnotes at the bottom of the page for more information.
* at 35% Federal tax rate
2-14-2025 Our Most Recent Tax-Free Performance & The Muni Market – The short term muni market rebounded resulting in the current twelve month total return increasing quite a bit (in conjunction with a poor performing month dropping off); however, even with our lower level of price and return volatility, we also picked up a bit of performance and are still pretty far ahead of the category average total return. This situation was true for most of the periods – please, see table below. We note that the short term U.S. Treasury yields, to us, seem to be quite a bit higher relative to short term average municipal bond yields (which we think are “too rich”), historically (and mathematically when taxes are taken into account); thus, we would expect short muni’s to have a bit of a “tough go” at least relative to U.S. Treasuries over the next several months.
Stamper Capital & Investments, Inc.
Separately Managed Accounts (National Tax-Free) vs. Tax-Free Municipal Bond Indices
Annual Total Returns, Period Ended 1-31-2025
| PERIOD | Morningstar Muni Short Category Average | SCI Separately Managed Tax-Fee Municipal Accounts Composite Net of Fees | SCI Separately Managed Accounts Net Pre-Tax Equivalent* | Bloomberg Barclay’s 3 Year Tax-Free Muni Bond Index |
|---|---|---|---|---|
| 1 Year | 3.07% | 3.80% | 5.85% | 2.79% |
| 3 Years | 1.70% | 2.82% | 4.34% | 1.40% |
| 5 Years | 1.18% | 2.43% | 3.74% | 1.04% |
| 10 Years | 1.24% | 2.26% | 3.48% | 1.34% |
| 15 Years | 1.43% | 2.21% | 3.39% | 1.56% |
| Since Inception (1/1/1995) | N/A | 3.65% | 5.62% | N/A |
Note: Indices do not have fees (trading costs, custody fees, management fees, etc.) deducted from their returns. We now have a much more reasonable index to compare to – the Bloomberg Barclay’s 3 Year Tax-Free Municipal Index. We still aim for similar or better returns with less risk – The key with this table is that our longer term pre-tax municipal bond returns are noticeably higher than the bond market index but with What We Think is less risk – we will see when rates start to rise and/or credit quality yield spreads widen.
Please see the Disclaimer and Footnotes at the bottom of the page for more information.
* at 35% Federal tax rate
1-31-2025 The Equity Markets – More Important Divergences? Final Equity Top(s)? In our previous Market Comment (below) we talked about more potential All-Time Equity Highs being “In” (for those where it wasn’t already evident). Since then, the Dow Jones Industrials, the S&P500 and the NASDAQ have shot back up to very very near their previous All-Time Highs. Usually, when indices get that close to achieving a new notable high, they do so (using Closing prices) but not this time so far. Only the S&P500 Cash (the normal one you buy – not the Futures) did put in a new All-Time High on 1-23-2025 at 6,118, 28 points above its previous All-Time High of 6,090 on 12-6-2024. But the S&P500 Futures just missed! at 6,152 on 1-23-2025 it was still 2 points lower than its All-Time Top of 6,154 on 12-16-2024. The Dow Industrials Cash was also just shy by 132 points at 44,882 on 1-30-2025 as compared to its All-Time High at 45,014 on 12-4-2024. The Dow Jones Industrial Average FUTURES was also close, but no cigar – its 12-4-2024 All-Time Peak is still 51 points above its second highest peak on 1-30-2025. Both the NASDAQ Comp (cash) and the NASDAQ Futures (NDQ) also missed taking out their December 2024 All-Time Highs and by more than the other misses and have since turned down a bit more. Importantly, essentially no other equity indices were close to achieving new All-Time Highs. Importantly, the U.S. Government announced Tariffs on China, Mexico and Canada on today, Friday 1-31-2025. Apparently, fears of a Trade War pushed the equity markets down from the previous market tops (yesterday or a bit earlier, depending). Since they got so close with only one putting in a New All-Time High (and because essentially all other equity categories were already much lower), it may be that The Tops are all in. Of course, we will see. Big Equity Tops are very “rounded” with some happening earlier and some later.
1-17-2025 Our Most Recent Tax-Free Performance & The Muni Market – As discussed previously, the bond market had a tough December 2024 (interest rates going up; bond prices dropping), including short term municipal bonds. However, The Stamper Capital Average had a good month and actually picked up 5 basis points for the current twelve months ending 12-31-2024. Unfortunately, the Municipal Short Term Category had a bad December 2024 and a very good month dropping off giving it a decline of 138 basis points for the current twelve months. Thus, for the one year we went from a slight underperformance to a large outperformance (see table below). Also, we increased our outperformance in all longer time periods. So, we had quite a return for the year, and with less volatility, which many consider a measure of risk; thus, matching or long-term goal of trying to maximize Risk-Adjusted Performance (as we did with The Fund for 20 years; and, hence, the name of our website!).
Stamper Capital & Investments, Inc.
Separately Managed Accounts (National Tax-Free) vs. Tax-Free Municipal Bond Indices
Annual Total Returns, Period Ended 12-31-2024
| PERIOD | Morningstar Muni Short Category Average | SCI Separately Managed Tax-Fee Municipal Accounts Composite Net of Fees | SCI Separately Managed Accounts Net Pre-Tax Equivalent* | Bloomberg Barclay’s 3 Year Tax-Free Muni Bond Index |
|---|---|---|---|---|
| 1 Year | 2.54% | 3.75% | 5.76% | 2.04% |
| 3 Years | 1.10% | 2.74% | 4.21% | 0.66% |
| 5 Years | 1.20% | 2.38% | 3.66% | 1.07% |
| 10 Years | 1.25% | 2.25% | 3.47% | 1.35% |
| 15 Years | 1.39% | 2.21% | 3.40% | 1.55% |
| Since Inception (1/1/1995) | N/A | 3.65% | 5.61% | N/A |
Note: Indices do not have fees (trading costs, custody fees, management fees, etc.) deducted from their returns. We now have a much more reasonable index to compare to – the Bloomberg Barclay’s 3 Year Tax-Free Municipal Index. We still aim for similar or better returns with less risk – The key with this table is that our longer term pre-tax municipal bond returns are noticeably higher than the bond market index but with What We Think is less risk – we will see when rates start to rise and/or credit quality yield spreads widen.
Please see the Disclaimer and Footnotes at the bottom of the page for more information.
* at 35% Federal tax rate
12-29-2024 The Bond Market – The bond market had a tough month. As forecast interest rates of longer bonds have begun (resumed) their rise and the yield curve has begun to steepen. The yield of the U.S. 30 year “Long Bond” rose from an intermediate bottom on 12-2-2024 of 4.32% to 4.82% (on 12-27-2024) or by 50 basis points. That is a significant move and, not only that, it broke a previous “higher low” of 4.62% and is now at the next “higher low” of 4.82% on 4-25-2024. But, even more important, the next step is the All-Time Yield High since the All-Time Yield low (1.05% 4-20-2020). That All-Time Yield High is 5.02% on 10-24-2023. If the yield of the U.S. Thirty Year breaches that level, we expect the trend of rising yields to continue & asset prices in general will almost certainly take a hit. Importantly, the U.S. 10 Year yield is in a similar situation. Thus, the yield curve has steepened and we expect it to continue to do so with longer yields rising. We are less certain on the short end of the yield curve.
Equities – Most U.S. Equities had been trending downwards from All-Time Tops over the past month or longer (depending upon the category) but they took their largest hit on 12-18-2024 in conjunction with the largest rise in interest rates during the period. We note that at this time we are seeing potential highs in place in most equity categories (also Junk Taxable Bonds and High Yield Municipal Bonds). We will take yet another stab at it – If longer term interest rates continue to rise as we are forecasting (above) and break through their All-Time Highs (since their All-Time Lows), we expect equities, in general, to be clobbered similarly & that The All-Time Tops Will Be In. Real Estate and all other asset categories that are heavily financed should also trade down accordingly. We do note that Sales Volumes (transactions) of single family houses have been contracting. Generally, we find that sales volumes contract/fall, before asset prices fall. We note that real estate sales volumes in our local market seem to have come to a standstill. So, the recipe for their prices falling (in addition to rising interest rates) seems to be in place, unfortunately.
12-19-2024 Our Most Recent Tax-Free Performance & The Muni Market – The Rolling returns of the short duration municipal bonds had a strong month drop off, resulting in a large drop in the rolling twelve month returns. Performances were still very strong as you can see in the table below; however, it let our accounts tighten their 12 month returns compared to the Category Average. Of course, as has been the case for a long time, we easily outperform for all longer periods – see the table below.
Stamper Capital & Investments, Inc.
Separately Managed Accounts (National Tax-Free) vs. Tax-Free Municipal Bond Indices
Annual Total Returns, Period Ended 11-30-2024
| PERIOD | Morningstar Muni Short Category Average | SCI Separately Managed Tax-Fee Municipal Accounts Composite Net of Fees | SCI Separately Managed Accounts Net Pre-Tax Equivalent* | Bloomberg Barclay’s 3 Year Tax-Free Muni Bond Index |
|---|---|---|---|---|
| 1 Year | 3.92% | 3.71% | 5.71% | 3.38% |
| 3 Years | 1.24% | 2.68% | 4.12% | 0.79% |
| 5 Years | 1.31% | 2.31% | 3.55% | 1.18% |
| 10 Years | 1.28% | 2.22% | 3.42% | 1.38% |
| 15 Years | 1.43% | 2.21% | 3.40% | 1.58% |
| Since Inception (1/1/1995) | N/A | 3.65% | 5.61% | N/A |
Note: Indices do not have fees (trading costs, custody fees, management fees, etc.) deducted from their returns. We now have a much more reasonable index to compare to – the Bloomberg Barclay’s 3 Year Tax-Free Municipal Index. We still aim for similar or better returns with less risk – The key with this table is that our longer term pre-tax municipal bond returns are noticeably higher than the bond market index but with What We Think is less risk – we will see when rates start to rise and/or credit quality yield spreads widen.
Please see the Disclaimer and Footnotes at the bottom of the page for more information.
* at 35% Federal tax rate
11-20-2024 Our Most Recent Tax-Free Performance & The Muni Market – The short end of the bond market continued to trade off during November 2024 and so did the municipals. We actually put in a very nice positive performance for the month while the Category Average lost 45 basis points and the Short Muni Index lost 57 basis points. For the current twelve months (including the new month and the month that dropped off, our Tax-Free total return improved by 5 basis points to 3.92% while the Category’s dropped 48 basis points down to 5.47% and the Index’s dropped 74 basis points down to 6.04%. We still lag for the current twelve months but our lead increased for all other time periods reported below (and with less volatility). Looking forward, still looking for the yield curve to steepen with longer bonds trading off (interest rates going up).
Stamper Capital & Investments, Inc.
Separately Managed Accounts (National Tax-Free) vs. Tax-Free Municipal Bond Indices
Annual Total Returns, Period Ended 10-31-2024
| PERIOD | Morningstar Muni Short Category Average | SCI Separately Managed Tax-Fee Municipal Accounts Composite Net of Fees | SCI Separately Managed Accounts Net Pre-Tax Equivalent* | Bloomberg Barclay’s 3 Year Tax-Free Muni Bond Index |
|---|---|---|---|---|
| 1 Year | 5.47% | 3.92% | 6.04% | 5.43% |
| 3 Years | 1.07% | 2.62% | 4.02% | 0.63% |
| 5 Years | 1.20% | 2.26% | 3.47% | 1.12% |
| 10 Years | 1.19% | 2.20% | 3.39% | 1.32% |
| 15 Years | 1.43% | 2.21% | 3.40% | 1.61% |
| Since Inception (1/1/1995) | N/A | 3.65% | 5.61% | N/A |
Note: Indices do not have fees (trading costs, custody fees, management fees, etc.) deducted from their returns. We now have a much more reasonable index to compare to – the Bloomberg Barclay’s 3 Year Tax-Free Municipal Index. We still aim for similar or better returns with less risk – The key with this table is that our longer term pre-tax municipal bond returns are noticeably higher than the bond market index but with What We Think is less risk – we will see when rates start to rise and/or credit quality yield spreads widen.
Please see the Disclaimer and Footnotes at the bottom of the page for more information.
* at 35% Federal tax rate
11-10-2024 Post-Election Summary – On the day after the U.S. National (and regional) elections, or on November 6th, 2024, most equity markets saw solid gains. The Dow Jones Industrial Average gained 1,508 points or 3.6%! And, in fact, some of the medium term Equity Indice divergences that we had been noting were “taken out.” For example, the Russell 2000 finally moved up to a new All-Time High to join the Dow Jones Industrials and the S&P500, etc. However, while that move was notable, more notable to us, was the 3 point drop (about 3%) in the price of the U.S. 30 Year Long Bond. That drop is also notable and the Bond market is about 3x as large as the stock market. Still, we note that some components of our short term equity forecast have been dislodged (at least temporarily). However, the fundamentals are still there – huge debt levels on a weak economy with prices in various areas already dropping somewhat. In addition, we think potential national policy changes that are being talked about are likely to be deflationary, especially with prices in various markets so high along with huge record debt levels. Implementation could be very tricky. We still think the All-Time Equity (Double, Second) Tops are very close by and do not expect current levels to be exceeded by much.
11-3-2024 Equities – We did get another rise in the Dow Jones Industrial average of under 1,000 points as we forecasted in our previous update. The Dow Jones Industrial Average moved up another 412 points to put in a new All-Time High on 10-18-2024 at 43,275. This is within the levels we have been forecasting. Importantly, not only do we see a reasonable ending upward structure, we now see a reasonable beginning downward structure, down 1,512 points to 4,1763 on 10-31-2024. The S&P500 also put in a new All-Time Top on 10-18-2024 and has dropped a smaller percentage. More interesting is the NASDAQ – The Comp put in a new All-Time High but the NASDAQ 100 did not. So we have that “Divergence” which is common at tops. Of course, the Major Equity Market Divergences are all the other equity indices that peaked six months to a year and a half ago. Importantly, both the NASDAQ and the NASDAQ 100 have put in what looks to us to be reasonable downward structures. Thus, we are more confident that these lagging All-Time Tops are in. But, of course, we will see. Action more close to the election might be interesting.
Interest Rates – Long term interest rates dropped quite a lot from May 2024 to September 2024; the yield of the U.S. Long Bond dropped 88.5 basis points, a large move. However, since then the yield has risen by 65 basis points taking back about 75% of that previous yield drop. And, the U.S. 10 Year has pretty much matched those moves. Important to us is that we think longer interest rates will continue to rise and breakout above their May 2024 yield highs. If that happens, we think the next stop will be the May 2024 high or 4.82% and then a bit above 5%. It currently sits at 4.59% so just getting to those levels is a notable move but we expect it could easily go much higher. The short end of the yield curve has also been rising but not as much as the long end. We have been forecasting that the Inverted Yield curve would be resolved by long rates rising in addition to short rates dropping. Right now if you look at the 2 year compared to the 30 year (which is how the pros normally look at it), the yield curve is no longer inverted (but is very flat). However, if you look from the 2 year to the 1 year to the 6 months to the 3 months, even to the 1 month, it is clearly inverted and definitely not “normal.” As we mentioned previously, we will look at the entire yield curve. As we have talked about many times, if interest rise, we expect assets that are heavily financed like stocks and bonds and even commodities will see their price fall proportionately, on average. We see possible, very interesting times ahead.
10-14-2024 Our Most Recent Tax-Free Performance & The Muni Market – The short end of the bond markets, including municipal bonds, rallied even more and the Index and the Short Muni Categories saw their short term returns shoot up. We tagged along but lost some of our out-performance. But, if you look at all longer periods we still shine. Looking forward, rates have dropped a lot and, most of the Category’s and Index’s short term returns are in the form of capital appreciation from prices rising as rates dropped. The result is that their average current yields are now much lower; thus, will generate less tax-free income going forward, and the upside price potential is also lower after such a great price rally. So, we are expecting our average to outperform fairly easily going forward.
Stamper Capital & Investments, Inc.
Separately Managed Accounts (National Tax-Free) vs. Tax-Free Municipal Bond Indices
Annual Total Returns, Period Ended 9-30-2024
| PERIOD | Morningstar Muni Short Category Average | SCI Separately Managed Tax-Fee Municipal Accounts Composite Net of Fees | SCI Separately Managed Accounts Net Pre-Tax Equivalent* | Bloomberg Barclay’s 3 Year Tax-Free Muni Bond Index |
|---|---|---|---|---|
| 1 Year | 5.95% | 3.87% | 5.95% | 6.17% |
| 3 Years | 1.20% | 2.51% | 3.86% | 0.72% |
| 5 Years | 1.35% | 2.24% | 3.44% | 1.33% |
| 10 Years | 1.26% | 2.19% | 3.37% | 1.38% |
| 15 Years | 1.42% | 2.19% | 3.36% | 1.63% |
| Since Inception (1/1/1995) | N/A | 3.65% | 5.61% | N/A |
Note: Indices do not have fees (trading costs, custody fees, management fees, etc.) deducted from their returns. We now have a much more reasonable index to compare to – the Bloomberg Barclay’s 3 Year Tax-Free Municipal Index. We still aim for similar or better returns with less risk – The key with this table is that our longer term pre-tax municipal bond returns are noticeably higher than the bond market index but with What We Think is less risk – we will see when rates start to rise and/or credit quality yield spreads widen.
Please see the Disclaimer and Footnotes at the bottom of the page for more information.
* at 35% Federal tax rate
10-13-2024 Equities – We did get the little drop we were looking for in our last update – on 10-7-2024 the Dow Jones Industrial Average put in an intermediate low at 41,835. Since that low, we believe we already have a rise large enough to finish “The Top” (All-Time for the Dow and the S&P 500, as almost all other indices had their All-Time Tops six months to two years ago). Right now the Dow Jones Industrial Average sits at 42,863 or up a little over 1,000 points from that 10-7-2024 bottom. We believe “The Top” could be “Now to up another 1,000 points or so.” Unbelievable accuracy (if correct) I’m sure, but we will see.
10-6-2024 Equities – As we speculated previously, both the Dow Jones Industrials & the S&P 500 put in new All-Time highs but essentially no other indices did – the Nasdaq and its Futures is closer and most other indices are still far below. We expect choppy slightly rising conditions to continue again- We note the beginning of this rise which we date as early to mid August 2024, is slowly losing momentum – which is usual for an equity market top (which is usually rounded). We would not be surprised to see a slight drop and then another rise to All-Time New Highs at least by the Dow Jones Industrials – a rise of up to about 2,000 points which is not really a lot percentage wise (and relative to the down side risk). The S&P 500 could tag along or diverge. The Nasdaq could do it with a spike high but we think that unlikely as at the top are usually divergences. We are looking for this top just before or, maybe, after the election (so pretty soon) – if it happens that way, we think this will be the Final Top for these last indices – others’ All-time Tops were two years to six months ago. It could happen for many reasons – The dominoes have been in place for many years. The war seems to be escalating and long term interest rates look, to us, to have resumed their rise from their 2020 bottom.
Interest Rates – As we speculated previously, the Federal Reserve lowered its rate by 50 basis points. Many think that was too much, but, as we showed below previously, the short term U.S. Treasury rate yield drop allowed for a 75 basis point cut (indicating, to us, that the economy is weak). More importantly, looking forward, to us, is that the Yield Curve is still inverted, even with the drop in yields at the short end of the curve. And now, to us, it looks like the longer term rates have resumed their rise from their 2022 bottom. Most professionals look at the difference in the yields of the Two Year and the Thirty Year to see if the Yield Curve has a normal Slant, but, to us, at least in this case, that leaves too much information out of the picture. If you look at it that way the Curve is already “back to normal” (not inverted) as the yield of the Two Year is 3.93% and the 30 Year’s is 4.25%. But if you look at the short end, the Curve is still pretty inverted; for example, the One Month Bill yield is 4.79% or 86 basis points higher than the Two Year. And that situation is true for the belly of the curve. So things are not quite right. We think the short end could come down more but, more importantly, that the long end will be rising noticeably. If the belly of the Yield Curve and the Long End do see noticeably rising interest rates, we would expect that asset prices would fall. We do note that, amazingly, this did not really happen to Real Estate prices during the rise in yields from their All-Time Lows (1.05% on 4-20-2020). However, this time the rise in interest rates would be starting from much higher levels. We think such a rise in interest rates would also impact prices of Precious Metals and also Industrial Commodities – Interest [financing] rates up, prices down. Of course, if war(s) break out, we could see some unusual price action in many commodities.
9-19-2024 Our Most Recent Tax-Free Performance & The Muni Market – The short end of the bond markets, including municipal bonds, rallied (prices up, yields down) again in August 2024. The Short Term Category Average was up several basis points over the shorter run periods but the month’s performance did not make much difference for the longer periods measured. Surprisingly, we did just a bit better in a similar pattern – & poorer performing months dropped off of the periods measured. The Short Term Municipal Bond Index did the best, as expected as it has no fees, etc. and has the most volatility – so it goes up more but it also goes down more.
Stamper Capital & Investments, Inc.
Separately Managed Accounts (National Tax-Free) vs. Tax-Free Municipal Bond Indices
Annual Total Returns, Period Ended 8-31-2024
| PERIOD | Morningstar Muni Short Category Average | SCI Separately Managed Tax-Fee Municipal Accounts Composite Net of Fees | SCI Separately Managed Accounts Net Pre-Tax Equivalent* | Bloomberg Barclay’s 3 Year Tax-Free Muni Bond Index |
|---|---|---|---|---|
| 1 Year | 4.65% | 3.60% | 5.53% | 4.57% |
| 3 Years | 0.96% | 2.44% | 3.75% | 0.62% |
| 5 Years | 1.19% | 2.22% | 3.42% | 1.12% |
| 10 Years | 1.21% | 2.15% | 3.31% | 1.33% |
| 15 Years | 1.47% | 2.21% | 3.40% | 1.65% |
| Since Inception (1/1/1995) | N/A | 3.65% | 5.61% | N/A |
Note: Indices do not have fees (trading costs, custody fees, management fees, etc.) deducted from their returns. We now have a much more reasonable index to compare to – the Bloomberg Barclay’s 3 Year Tax-Free Municipal Index. We still aim for similar or better returns with less risk – The key with this table is that our longer term pre-tax municipal bond returns are noticeably higher than the bond market index but with What We Think is less risk – we will see when rates start to rise and/or credit quality yield spreads widen.
Please see the Disclaimer and Footnotes at the bottom of the page for more information.
* at 35% Federal tax rate
9-18-2024 Interest Rates – Pending Fed Cut – The Federal Reserve has announced it will lower the Fed Funds rate today at 2 p.m. Eastern. Market prognosticators are speculating on how much the Fed will cut. What is very interesting to us is that “The Common Wisdom” is that the Fed sets the rates and the market follows. However, as we have discussed several times, we believe the Fed follows the markets & this particular time highlights that contention. The last time the Fed changed its interest rate was in July 2023, the last of 11 raises over a year and a half from March 2022 until July 2023. We believe the Fed follows a combination of the yields of the 3 and the 6 month U.S. T-bills. Since July 2023 the 6 month Bill fell from 5.48% to 4.61% or by 87 basis points; the 3 month Bill fell from 5.40% down to 4.89% or by 51 basis points. Note: that most of those drops happened over the past two months; still, the Fed has waited longer than usual to follow the market yields downward. We have read that market consensus is a 25 basis point cut; however, we think the Fed could easily cut it 50 basis points as that would be within the drops in market yields of both the 6 month and 3 month T-bills.
Sometimes the other markets like equties move in conjunction with the Fed moving its interest rate, but it seems to us that significant market moves only happen if the Fed does not match the market (which we think this time would be a cut of 50 basis points, per above). We think if they only cut by 25 basis points or if they cut by 75 basis points, we could see some noticeable movement in prices in other markets – only 25 bp, then probably a drop in prices; 75 bp, maybe a rally. Of course, we will see.
8-20-2024 – Equities – Since our last report there was a shocking decline in the equity indices; for example, the NASDAQ was down 12%! However, we have had large price rebounds since. We believe we are having yet another set of “market divergences” which, to us, are typical at tops – This being a HUGE TOP, these divergences have been spread out over years! Currently, it looks to us that the Dow Jones Industrials and the S&P500 could put in new All-time highs – they are very close. However, the divergence this time would be that the NASDAQ does not and that is the way it looks to us currently. As for (most of) the rest of the equity indices, they are still fairly far below their all-time highs of four months to 2 years ago and we continue to think they are “done.” Of course, we will see.
Commodities – Gold put in yet another (slight) All-time new high again not followed by sliver. Industrial commodities like Copper continue to decline or chop sideways. So, we do not think we are in a general inflation like in the late 1970’s (likely limited by the dramatically larger amounts of debt outstanding now as compared to then). And, because we believe interest rates will resume their rise shortly, at least at the long end (resulting in the yield curve Un-inverting), and commodities (and every thing else) are currently heavily leveraged, we expect rising interest rates will push down prices of most asset categories.
8-20-2024 – Our Most Recent Tax-Free Performance & The Muni Market – The short term muni market had a huge rally with the Short Term Category Average increasing by 103 basis points. Our performance was slightly better than its previous 12 month period; we lagged as we were giving up upside potential to pick up current (tax-free) yield and extra downside protection. However, even with the huge outperformance for the current month, the category averages, for the longer periods, did not improve all that much. Thus, our longer term actual, and especially relative, performance is still outstanding, per the table, below.
Stamper Capital & Investments, Inc.
Separately Managed Accounts (National Tax-Free) vs. Tax-Free Municipal Bond Indices
Annual Total Returns, Period Ended 7-31-2024
| PERIOD | Morningstar Muni Short Category Average | SCI Separately Managed Tax-Fee Municipal Accounts Composite Net of Fees | SCI Separately Managed Accounts Net Pre-Tax Equivalent* | Bloomberg Barclay’s 3 Year Tax-Free Muni Bond Index |
|---|---|---|---|---|
| 1 Year | 4.53% | 3.42% | 5.27% | 4.45% |
| 3 Years | 0.88% | 2.41% | 3.70% | 0.38% |
| 5 Years | 1.19% | 2.20% | 3.38% | 1.05% |
| 10 Years | 1.22% | 2.13% | 3.28% | 1.32% |
| 15 Years | 1.48% | 2.21% | 3.40% | 1.61% |
| Since Inception (1/1/1995) | N/A | 3.64% | 5.61% | N/A |
Note: Indices do not have fees (trading costs, custody fees, management fees, etc.) deducted from their returns. We now have a much more reasonable index to compare to – the Bloomberg Barclay’s 3 Year Tax-Free Municipal Index. We still aim for similar or better returns with less risk – The key with this table is that our longer term pre-tax municipal bond returns are noticeably higher than the bond market index but with What We Think is less risk – we will see when rates start to rise and/or credit quality yield spreads widen.
Please see the Disclaimer and Footnotes at the bottom of the page for more information.
* at 35% Federal tax rate
__________________________________________________
7-18-2024 – Our Most Recent Tax-Free Performance & The Muni Market – The short term muni market had a pretty good performance for the month of June 2024; we did too but, lagged slightly. Still, we are ahead of the Category Average for the current twelve months & substantially ahead for all longer periods because we did much better during the tougher months over the years!
Stamper Capital & Investments, Inc.
Separately Managed Accounts (National Tax-Free) vs. Tax-Free Municipal Bond Indices
Annual Total Returns, Period Ended 6-30-2024
| PERIOD | Morningstar Muni Short Category Average | SCI Separately Managed Tax-Fee Municipal Accounts Composite Net of Fees | SCI Separately Managed Accounts Net Pre-Tax Equivalent* | Bloomberg Barclay’s 3 Year Tax-Free Muni Bond Index |
|---|---|---|---|---|
| 1 Year | 3.19% | 3.36% | 5.17% | 2.62% |
| 3 Years | 0.58% | 2.31% | 3.56% | 0.01% |
| 5 Years | 1.08% | 2.19% | 3.38% | 0.91% |
| 10 Years | 1.09% | 2.12% | 3.26% | 1.18% |
| 15 Years | 1.46% | 2.23% | 3.43% | 1.59% |
| Since Inception (1/1/1995) | N/A | 3.64% | 5.61% | N/A |
Note: Indices do not have fees (trading costs, custody fees, management fees, etc.) deducted from their returns. We now have a much more reasonable index to compare to – the Bloomberg Barclay’s 3 Year Tax-Free Municipal Index. We still aim for similar or better returns with less risk – The key with this table is that our longer term pre-tax municipal bond returns are noticeably higher than the bond market index but with What We Think is less risk – we will see when rates start to rise and/or credit quality yield spreads widen.
Please see the Disclaimer and Footnotes at the bottom of the page for more information.
* at 35% Federal tax rate
7-17-2024 – Equities – We are seeing some interesting Large divergences in the equities. We did not expect that the Dow Jones Industrial average would put in new All-Time Highs. We did previously highlight how it had diverged against the S&P 500 and the NASDAQ in not following along with them to new All-time highs. However, now The Industrial Average has BUT, as it was, the NASDAQ was dropping about 5% which is a fairly large move. Divergences like these happen at Top Turning Points, so that may be what is happening. Also, note that most of the other indices’ All-Time highs are still six months to two years ago – so those divergences are still intact.
Commodities – Commodities are also interesting with Gold putting in its own All-time high, but silver is not even close and the industrial commodities like oil and copper are trending downwards from prior highs. Thus, at this point we are not expecting a new wave of inflation.
Real Estate – We note a lot of homes that were purchased with almost zero percent interest rate financing from Adjustable loans are starting to reset much higher yields. These loans typically have “lock out periods” of so many years and limitations oh how much the interest rate they are charged can rise and when. After a period of time, those higher rates will be reflected in their monthly mortgage bill. This could be happening right now and could be the reason that retail has begun to falter as those borrowers are likely being a lot more careful with how they are spending their money since more is going to their mortgage interest. If interest rates continue to rise and/or adjustable rate yields continue to reset upwards, normally, prices of real estate drop (even though we have not see that with the large rise in interest rates over the past three years – which is highly unusual, at least during most of the last 50 years).
6-20-2024 – Equities – The current forecast model of what is going on in the equity markets is still intact – thus, so is our Super All Everything Double Top. As forecast, those few equity indices that have been putting in new highs are again putting in new highs – that is the NASDAQ and the S&P 500 – basically those that have an overweight in Nivida and Apple, and a few other stocks. Importantly, market tops very often see such concentrated positive performance as we have been seeing. Also important, the Dow Jones Industrials have dropped out of putting in new highs and, at least for now, have joined all the other equity indices we mentioned previously that are not putting in new highs. In that regards, most notably, we are following the Russell 2000 and the Dow Jones Transports (among others listed previously).
Commodities – We continue to monitor the divergences in the performance of various commodities with Gold putting in record highs, pretty much all by itself. Silver is still lower. Industrial commodities oil and copper are also not near new highs. Thus, as we’ve talked about before, because of these divergences we do not believe we are in a raging inflation like the 1970’s where all commodities were going up and up and up…Before they crashed down in to the early 1980’s.
So, commodities are kind of in the same kind of situation as the equities with major divergences and some Record Highs – the market tops of the equities and the commodities are spread out over years which is normal for market tops – the bigger the spread, the bigger the top & this top is huge.
Bonds & Interest Rates – We think bonds and interest rates are likely the lynch pin that, when pulled in the form of higher interest rates (lower bond prices), will bring the entire over-leveraged structure down. Of course, we have been saying this for a while and the yield on the U.S. T-bill has risen from almost zero to over 5% over the past two years and asset prices have not plummeted…..yet, but we believe any more increases in interest rates will likely break the dam, unfortunately. Of course, we will see and don’t bet the ranch.
6-18-2024 – Our Most Recent Tax-Free Performance & The Muni Market – The short term muni market had a slightly negative May 2024 but, for the current twelve months, a much worse month dropped off, which gave a nice rise in their total returns for the current twelve months. However, because of the current month drop, all other time periods of the averages saw declines in their total returns. On the other hand, were fortunate to have fairly large positive performance for the current month keeping us from lagging since the performance of the month that we dropped (for the current twelve months) was not as negative as were the averages. The result is that we did very well for the current twelve months and also increased our total returns for all longer periods, and, important since we are trying to maximize risk-adjusted performance, we did it with less volatility!
Stamper Capital & Investments, Inc.
Separately Managed Accounts (National Tax-Free) vs. Tax-Free Municipal Bond Indices
Annual Total Returns, Period Ended 5-31-2024
| PERIOD | Morningstar Muni Short Category Average | SCI Separately Managed Tax-Fee Municipal Accounts Composite Net of Fees | SCI Separately Managed Accounts Net Pre-Tax Equivalent* | Bloomberg Barclay’s 3 Year Tax-Free Muni Bond Index |
|---|---|---|---|---|
| 1 Year | 3.03% | 3.31% | 5.10% | 2.44% |
| 3 Years | 0.36% | 2.25% | 3.45% | -0.23% |
| 5 Years | 0.97% | 2.16% | 3.32% | 0.84% |
| 10 Years | 1.02% | 2.09% | 3.22% | 1.11% |
| 15 Years | 1.40% | 2.22% | 3.41% | 1.56% |
| Since Inception (1/1/1995) | N/A | 3.64% | 5.60% | N/A |
Note: Indices do not have fees (trading costs, custody fees, management fees, etc.) deducted from their returns. We now have a much more reasonable index to compare to – the Bloomberg Barclay’s 3 Year Tax-Free Municipal Index. We still aim for similar or better returns with less risk – The key with this table is that our longer term pre-tax municipal bond returns are noticeably higher than the bond market index but with What We Think is less risk – we will see when rates start to rise and/or credit quality yield spreads widen.
Please see the Disclaimer and Footnotes at the bottom of the page for more information.
* at 35% Federal tax rate
5-16-2024 – Equities – So far so good for our current forecast, below, that those equity indices that had put in new All-Time Highs (over the past few years) would do so again, but those that did not, would not. And, that is what has happened. For example, both The S&P 500 and the Dow Jones Industrial Averages just put in new All-Time highs but the Russell 2000 (RUT) is still 9.3% below its 6-1-2021 All-Time High. This type of divergence is normal at “market tops” where the tops of various categories are spread out over time – the more spread out, likely the larger the top – and this one is currently very spread out. We don’t think the current rally is over but we think most equity indices that are not putting in new All-Time Highs right now will not quite make it by the time the whole thing turns down – “The Top Is In.” Of course, we will see.
5-16-2024 – Our Most Recent Tax-Free Performance & The Muni Market – The return for the Short Term Category average was down about 20 basis points while the index was down about 38 basis points; however, because of the performances of the month that dropped off, the Category down only slightly for the current twelve months while the Index was up 16 basis points. Unfortunately, their negative current month returns brought down their long term average returns. We had a good month and improved by 11 basis points for the current twelve months and, also, improved just slightly or stayed even for all but one of the longer term periods.
Stamper Capital & Investments, Inc.
Separately Managed Accounts (National Tax-Free) vs. Tax-Free Municipal Bond Indices
Annual Total Returns, Period Ended 4-30-2024
| PERIOD | Morningstar Muni Short Category Average | SCI Separately Managed Tax-Fee Municipal Accounts Composite Net of Fees | SCI Separately Managed Accounts Net Pre-Tax Equivalent* | Bloomberg Barclay’s 3 Year Tax-Free Muni Bond Index |
|---|---|---|---|---|
| 1 Year | 2.67% | 3.17% | 4.88% | 1.90% |
| 3 Years | 0.37% | 2.17% | 3.34% | -0.23% |
| 5 Years | 1.08% | 2.14% | 3.30% | 0.99% |
| 10 Years | 1.05% | 2.07% | 3.18% | 1.14% |
| 15 Years | 1.44% | 2.20% | 3.39% | 1.57% |
| Since Inception (1/1/1995) | N/A | 3.64% | 5.60% | N/A |
Note: Indices do not have fees (trading costs, custody fees, management fees, etc.) deducted from their returns. We now have a much more reasonable index to compare to – the Bloomberg Barclay’s 3 Year Tax-Free Municipal Index. We still aim for similar or better returns with less risk – The key with this table is that our longer term pre-tax municipal bond returns are noticeably higher than the bond market index but with What We Think is less risk – we will see when rates start to rise and/or credit quality yield spreads widen.
Please see the Disclaimer and Footnotes at the bottom of the page for more information.
* at 35% Federal tax rate
4-17-2024 – A Whiff of Inflation and interest rates go up (bonds down) and stocks slump – That is what we speculated was going on (previously) & interest rates have continued to break up from the short-intermediate term on out, and most equity indicies have been putting in lower lows, so much so (with a lot more information and analysis than that) that we believe “The Second Top” is likely “In” at least for the vast majority of stock indices. For example, the Russel 2000 (proxy “RUT”) is down about 8%; the Dow Jones Industrial Average is down about 5%. Still holding, as we pointed out below, only certain indicies have put in “new all-time highs” for their “Second Tops;” – most have not and we did not and do not expect them to. In fact, we think that, for those that have not, their second tops are in; for those that did, we think they likely could go higher. We think the most likely case is that, of those that did put in new All-time highs, only a couple might put in new ones – not the rest. In other words, we believe the Second Tops are likely in for the majority of the equity market. Confirmation would come with a new significant drop.
As for commodities, Silver did join Gold in putting in new All-time highs but most industrial commodities have not. Given our current Acting Model that any whiffs of inflation will continue to push interest rates up (bond prices down) giving headwinds to all asset prices, including not only industrial commodities but also financial commodities like gold and silver. Still, we would not bet the ranch on this – it seems easier to predict the bond market (interest rates) and stock prices. Of course, rising interest rates would also push real estate, which is hugely overvalued, down in price. The iShares U.S. Real Estate ETF (“IYR) is down almost 30% from its All-Time High on 12-1-2021. Hence, we believe the residential real estate market has a lot of catching up to do. Up to this point, we believe significant other factors have held it up – will they continue? that is the question.
4-17-2024 – Our Most Recent Tax-Free Performance & The Muni Market – The return for the Short Term Category average was essentially zero for the month and the month that dropped off for the current twelve months was pretty good, so the Category Average total return dropped a bit. The Short Index got hit worse. However, we actually had a bit of a positive total return for the current month resulting in a rise in our current 12 month return. Of course, the one year performances are not nearly as important as the longer terms and that is where we shine in the chart below:
Stamper Capital & Investments, Inc.
Separately Managed Accounts (National Tax-Free) vs. Tax-Free Municipal Bond Indices
Annual Total Returns, Period Ended 3-31-2024
| PERIOD | Morningstar Muni Short Category Average | SCI Separately Managed Tax-Fee Municipal Accounts Composite Net of Fees | SCI Separately Managed Accounts Net Pre-Tax Equivalent* | Bloomberg Barclay’s 3 Year Tax-Free Muni Bond Index |
|---|---|---|---|---|
| 1 Year | 2.66% | 3.06% | 4.70% | 1.74% |
| 3 Years | 0.47% | 2.14% | 3.30% | -0.05% |
| 5 Years | 1.13% | 2.15% | 3.31% | 1.06% |
| 10 Years | 1.10% | 2.06% | 3.17% | 1.20% |
| 15 Years | 1.50% | 2.23% | 3.43% | 1.61% |
| Since Inception (1/1/1995) | N/A | 3.64% | 5.60% | N/A |
Note: Indices do not have fees (trading costs, custody fees, management fees, etc.) deducted from their returns. We now have a much more reasonable index to compare to – the Bloomberg Barclay’s 3 Year Tax-Free Municipal Index. We still aim for similar or better returns with less risk – The key with this table is that our longer term pre-tax municipal bond returns are noticeably higher than the bond market index but with What We Think is less risk – we will see when rates start to rise and/or credit quality yield spreads widen.
Please see the Disclaimer and Footnotes at the bottom of the page for more information.
* at 35% Federal tax rate
4-2-2024 – Interest Rates & Stocks & Commodities Update – Based on a ZeroHedge article today, “Market Now More Hawkish Than The Fed As June Rate-Cut Odds Fade” forecasts for 2024 by 13 broker/dealer economists is from 75 basis points to 125 basis points. In fact, based on the futures market, “…the market is now pricing in just 65bps of rate-cuts in 2024 (remember in January it was pricing in almost 170bps of cuts).” However, we post the following graph from 2016 through 3-15-2024 showing (if you look very closely) that the Fed Funds rates lags the combination of the U.S. 3 month and 6 month T-Bill yields:
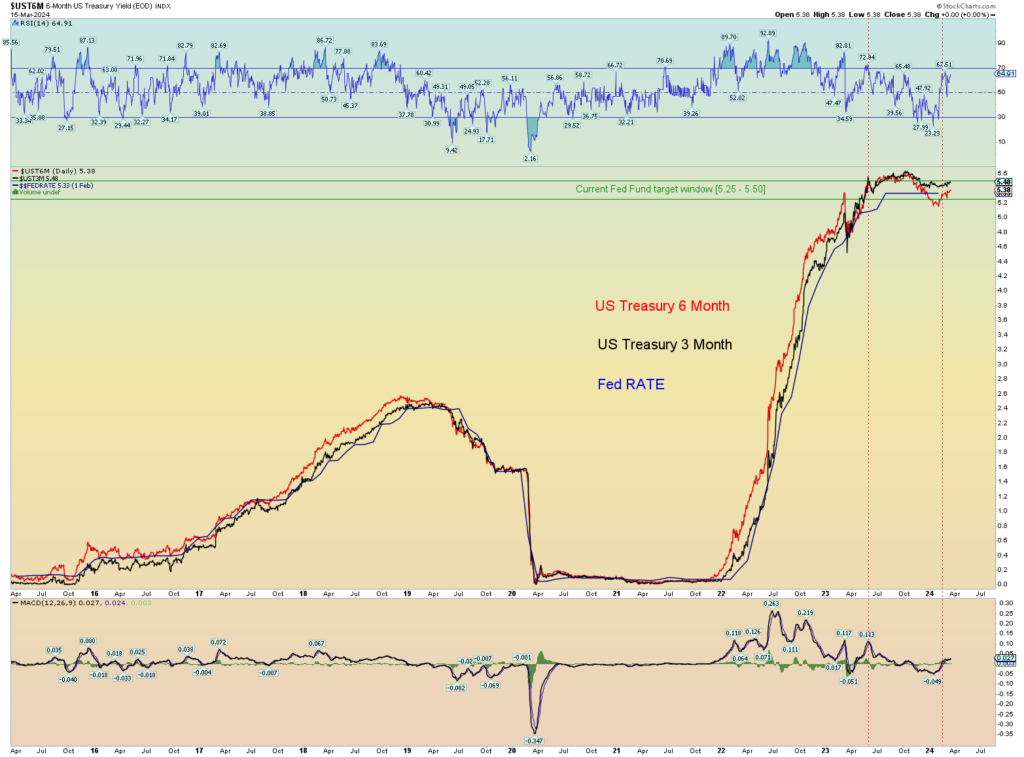
Importantly, on 3-15-2024 both the 3 & 6 month U.S. T-bill yields were above the Fed Funds rate, making it, to us, unlikely that a cut will be made, at least in April [and quite possibly the rest of the year per inflation fears per the next paragraph].
In conjunction with that information and based on the rise of gold to new highs, we posited to an acquaintance on 4-2-2024:
“I guess the treasury market traded off a bit….it seems to me when gold hit
a new high…bonds traded off, interest rates up…Looks like the Ten Year and 30 Year yields are breaking up….Reminds me of the late 1970’s – so they’d been pumping the money supply and creating this inflation for several years [in the 1970’s]….until, it started causing interest rates to go up…then they had to stop printing money….This time [now], much earlier in the cycle (not nearly as much inflation) because the debt levels are enormously larger, I suppose. Of course, We will see.”
Importantly, interest rates went up and up and up after that time.
Thus, we believe the cycle of easing/increasing the money supply by credit and/or fiat inflation could very well be over because gold has put in new highs – it looks to us like “the brakes have been put on.” The evidence is that the yields on the 10 year and the 30 year have broken up (although only slightly at this juncture). If we are correct, we expect the prices of assets like stocks to start to tumble as the prices of real estate did from 1979 down into the 1982-1985 bottoms. Of course, we will see.
One may ask, “How do you know it isn’t a general inflation like the 1970’s?” Our answer is that, of course, we don’t for sure, but in the 1970’s all commodity prices were hitting new highs; however, right now, it is only gold, not oil, not silver, etc. Still, that one special commodity is enough to stop fiat/credit inflation policies, especially with short term rates fairly high and not falling so far. However, if other commodities join in, that could change our outlook. Another part of our answer is that the 1970’s inflation was mostly fiat (more dollars) but the current Super Bubble, until recently, is mostly credit (borrowing and lending) – At a certain point, more credit cannot be issued, and, fiat inflation (including debt bailout/forgiveness) more directly turns into rising commodity prices – it seems to us, that we are at that point and if the bubble isn’t inflating it is deflating, unfortunately.
3-18-2024 – Our Most Recent Tax-Free Performance – What happened last month in the short term municipal bond market reversed for the current 12 months, as a very bad month dropped off and the latest month came in relatively strong. The result is a very big rebound in the total return of the Category Average and the Category Index of about 100 basis points. Our rebound for the current 12 months was 21 basis points, but we never dropped as much. To us, the “proof” is in the Three Year total returns! You can see we have done very well.
Stamper Capital & Investments, Inc.
Separately Managed Accounts (National Tax-Free) vs. Tax-Free Municipal Bond Indices
Annual Total Returns, Period Ended 2-29-2024
| PERIOD | Morningstar Muni Short Category Average | SCI Separately Managed Tax-Fee Municipal Accounts Composite Net of Fees | SCI Separately Managed Accounts Net Pre-Tax Equivalent* | Bloomberg Barclay’s 3 Year Tax-Free Muni Bond Index |
|---|---|---|---|---|
| 1 Year | 3.73% | 3.27% | 5.03% | 3.55% |
| 3 Years | 0.54% | 2.08% | 3.20% | 0.12% |
| 5 Years | 1.21% | 2.16% | 3.32% | 1.19% |
| 10 Years | 1.07% | 2.05% | 3.15% | 1.19% |
| 15 Years | 1.52% | 2.23% | 3.43% | 1.67% |
| Since Inception (1/1/1995) | N/A | 3.64% | 5.61% | N/A |
Note: Indices do not have fees (trading costs, custody fees, management fees, etc.) deducted from their returns. We now have a much more reasonable index to compare to – the Bloomberg Barclay’s 3 Year Tax-Free Municipal Index. We still aim for similar or better returns with less risk – The key with this table is that our longer term pre-tax municipal bond returns are noticeably higher than the bond market index but with What We Think is less risk – we will see when rates start to rise and/or credit quality yield spreads widen.
Please see the Disclaimer and Footnotes at the bottom of the page for more information.
* at 35% Federal tax rate
2-18-2024 – Our Most Recent Tax-Free Performance – Wow, after its best month last month, the short term municipal market’s one year (12 month) return dropped about 100 basis points, as a great month dropped off the front of the period. Our performance also dropped for the current period but not anywhere near as much – only slightly; and now, we are leading the average again for the current 12 months and, importantly, with much less volatility (“measured risk”). The three year return shows our largest relative lead but the other years look good too.
Stamper Capital & Investments, Inc.
Separately Managed Accounts (National Tax-Free) vs. Tax-Free Municipal Bond Indices
Annual Total Returns, Period Ended 1-31-2024
| PERIOD | Morningstar Muni Short Category Average | SCI Separately Managed Tax-Fee Municipal Accounts Composite Net of Fees | SCI Separately Managed Accounts Net Pre-Tax Equivalent* | Bloomberg Barclay’s 3 Year Tax-Free Muni Bond Index |
|---|---|---|---|---|
| 1 Year | 2.60% | 3.06% | 4.71% | 1.83% |
| 3 Years | 0.31% | 2.05% | 3.16% | -0.03% |
| 5 Years | 1.23% | 2.14% | 3.30% | 1.23% |
| 10 Years | 1.10% | 2.03% | 3.13% | 1.21% |
| 15 Years | 1.48% | 2.23% | 3.43% | 1.65% |
| Since Inception (1/1/1995) | N/A | 3.65% | 5.61% | N/A |
Note: Indices do not have fees (trading costs, custody fees, management fees, etc.) deducted from their returns. We now have a much more reasonable index to compare to – the Bloomberg Barclay’s 3 Year Tax-Free Municipal Index. We still aim for similar or better returns with less risk – The key with this table is that our longer term pre-tax municipal bond returns are noticeably higher than the bond market index but with What We Think is less risk – we will see when rates start to rise and/or credit quality yield spreads widen.
Please see the Disclaimer and Footnotes at the bottom of the page for more information.
* at 35% Federal tax rate
2-1-2024 – Huge and Numerous Divergences – The Super All-Everything DOUBLE Top – We spent a lot of ink talking about the numerous divergences, in terms of times and prices of various assets and asset classes, that compel us to think the markets are putting in a Huge Top – in our 2024 Market Comment & Annual Forecast (dated 1-30-2024). One Divergence we didn’t highlight, which we will talk about here, is that between the NASDAQ Comp and the NASDAQ 100. Right now, the narrower NASDAQ 100 is 4.8% above its previous All-Time High on 11-14-2021. However, the broader NASDAQ COMP is still 4.6% below its All-Time High of 11-14-2021. We don’t know if the NASDAQ Comp will put in a new All-Time High but our experience is that it is a normal situation in large tops for similar or related indices to put in official tops at different times of some significance. Also, if you consider the two against each other, you could say the difference is 10% – not huge but notable. Important, to us, is that the more these divergences continue, the more we believe we are experiencing a huge market top, which will be followed by a huge decline. Of course, we will see.
1-17-2024 – Our Most Recent (& Full Year 2023) Tax-Free Performance – The short term municipal bond market had its best month of the year with large price rebounds (yield drops). You can see the performance for the 12 months ending 12-31-2023 in the table below. The average fund did very well in December 2023, improving by 87 basis points! While we did not post as large a rebound, the difference highlights the lower risk (as measured by volatility) of our accounts’ performance. The easiest way to see that higher risk-adjusted performance is to look at the Three Year and Five Year performances and the One Year performance. And, of course, Ten and Fifteen Years also. We achieved our out-performance in all longer run time periods with less volatility & that is our goal!
Stamper Capital & Investments, Inc.
Separately Managed Accounts (National Tax-Free) vs. Tax-Free Municipal Bond Indices
Annual Total Returns, Period Ended 12-31-2023
| PERIOD | Morningstar Muni Short Category Average | SCI Separately Managed Tax-Fee Municipal Accounts Composite Net of Fees | SCI Separately Managed Accounts Net Pre-Tax Equivalent* | Bloomberg Barclay’s 3 Year Tax-Free Muni Bond Index |
|---|---|---|---|---|
| 1 Year | 3.72% | 3.12% | 4.480% | 3.45% |
| 3 Years | 0.39% | 2.02% | 3.11% | 0.11% |
| 5 Years | 1.31% | 2.14% | 3.29% | 1.37% |
| 10 Years | 1.15% | 2.02% | 3.11% | 1.27% |
| 15 Years | 1.61% | 2.28% | 3.51% | 1.79% |
| Since Inception (1/1/1995) | N/A | 3.65% | 5.61% | N/A |
Note: Indices do not have fees (trading costs, custody fees, management fees, etc.) deducted from their returns. We now have a much more reasonable index to compare to – the Bloomberg Barclay’s 3 Year Tax-Free Municipal Index. We still aim for similar or better returns with less risk – The key with this table is that our longer term pre-tax municipal bond returns are noticeably higher than the bond market index but with What We Think is less risk – we will see when rates start to rise and/or credit quality yield spreads widen.
Please see the Disclaimer and Footnotes at the bottom of the page for more information.
* at 35% Federal tax rate
12-17-2023 U.S. Stock Market DOUBLE TOP – The Dow Jones Industrial Average just put in a slight “higher high” – that is correct it is essentially at the same level of its All-Time Market Peak of late 2021. Most importantly, while we believe it could go a bit higher and, if it does, the S&P 500 will likely join it in a new All-Time Market High (it has not yet), however, we believe the prices of most indices and asset categories will not. For example, the Russell 2000 (“RUT”) is about 18% below its All-Time High. Interestingly, the NASDAQ 100 is now at an All-Time Market Peak but the NASDAQ Composite is not – it is a bit over 7% below its. We expect that divergence to hold but will be watching it closely. Of course, it demonstrates that the rebound has been very narrow (as we have documented previously); thus, the 100 has outpaced the Composite.
Here are some reasons why expect a Double Top in only a few indices. We have been following prices in the used goods markets, especially, ultra light hiking equipment, road & mountain bikes, stand up paddle boards (and reading others about prone long boards). Prices are down about 50%.
We just saw an article on prices of used Rolex Watches. Apparently, it is having a similar experience:
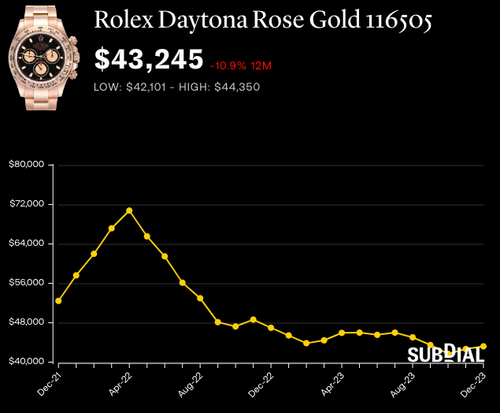
So while the narrow number of stocks has been rebounding, other markets are still deteriorating. We have also seen that with oil versus gold. Gold as also put in a slight new All-Time High! However, oil (West Texas Intermediate Crude) has dropped almost 23% since late September 2023, and is 40% below its All-Time Top in mid 2022. Thus, we believe these divergences will hold and over the next few months, most if not all categories will start having notable price declines. Of course, we will see.
12-13-2023 – Our Most Recent Tax-Free Performance – The short term municipal bond market had another great month with large price rebounds (yield drops). That is interesting in that the short term U.S. T-bill market barely budged. So municipal bonds, at the short end of the curve are getting “richer” compared to U.S. T-bills – they were fairly cheap (when not taking into account credit quality). At some point short term municipal bond yields will be too rich. Our accounts also had somewhat of a rebound; however, based on how we have the portfolios structured, our prices are more stable, which was a huge plus when interest rates were shooting up over the past three years, as you can see in our performance in the chart below!
Stamper Capital & Investments, Inc.
Separately Managed Accounts (National Tax-Free) vs. Tax-Free Municipal Bond Indices
Annual Total Returns, Period Ended 11-30-2023
| PERIOD | Morningstar Muni Short Category Average | SCI Separately Managed Tax-Fee Municipal Accounts Composite Net of Fees | SCI Separately Managed Accounts Net Pre-Tax Equivalent* | Bloomberg Barclay’s 3 Year Tax-Free Muni Bond Index |
|---|---|---|---|---|
| 1 Year | 2.92% | 2.91% | 4.48% | 2.65% |
| 3 Years | 0.16% | 1.96% | 3.01% | -0.13% |
| 5 Years | 1.21% | 2.12% | 3.26% | 1.33% |
| 10 Years | 1.04% | 2.00% | 3.08% | 1.18% |
| 15 Years | 1.57% | 2.30% | 3.54% | 1.79% |
| Since Inception (1/1/1995) | N/A | 3.65% | 5.61% | N/A |
Note: Indices do not have fees (trading costs, custody fees, management fees, etc.) deducted from their returns. We now have a much more reasonable index to compare to – the Bloomberg Barclay’s 3 Year Tax-Free Municipal Index. We still aim for similar or better returns with less risk – The key with this table is that our longer term pre-tax municipal bond returns are noticeably higher than the bond market index but with What We Think is less risk – we will see when rates start to rise and/or credit quality yield spreads widen.
Please see the Disclaimer and Footnotes at the bottom of the page for more information.
* at 35% Federal tax rate
11-15-2023 – Our Most Recent Tax-Free Performance – Our Three Year Performance tells the best story – seeking to achieve the best return for the risk!
Stamper Capital & Investments, Inc.
Separately Managed Accounts (National Tax-Free) vs. Tax-Free Municipal Bond Indices
Annual Total Returns, Period Ended 10-31-2023
| PERIOD | Morningstar Muni Short Category Average | SCI Separately Managed Tax-Fee Municipal Accounts Composite Net of Fees | SCI Separately Managed Accounts Net Pre-Tax Equivalent* | Bloomberg Barclay’s 3 Year Tax-Free Muni Bond Index |
|---|---|---|---|---|
| 1 Year | 2.41% | 2.74% | 4.21% | 2.11% |
| 3 Years | -0.38% | 1.79% | 2.76% | -0.85% |
| 5 Years | 0.87% | 2.04% | 3.14% | 0.93% |
| 10 Years | 0.82% | 1.96% | 3.01% | 0.94% |
| 15 Years | 1.45% | 2.28% | 3.51% | 1.73% |
| Since Inception (1/1/1995) | N/A | 3.64% | 5.60% | N/A |
Note: Indices do not have fees (trading costs, custody fees, management fees, etc.) deducted from their returns. We now have a much more reasonable index to compare to – the Bloomberg Barclay’s 3 Year Tax-Free Municipal Index. We still aim for similar or better returns with less risk – The key with this table is that our longer term pre-tax municipal bond returns are noticeably higher than the bond market index but with What We Think is less risk – we will see when rates start to rise and/or credit quality yield spreads widen.
Please see the Disclaimer and Footnotes at the bottom of the page for more information.
* at 35% Federal tax rate
11-06-2023 – Market Update – We’ve been on a roll. So, the Lower Lows we forecasted in both the Bond Market and the Equity Markets happened in Late October 2023 – on 10-27-2023 in most indices like the Dow Jones Industrials and the S&P 500. A very notable Lower Low was in the Russell 2000 on 10-22-2023 which was as low as it was back on 11-1-2020, about 3 years ago.
Of course, we haven’t been forecasting a market that is going straight down but a Series of Lower Lows and Lower Highs. And, right now, equity indices have since been rebounding sharply (which is normal in Bear Markets – see our Analysis for the Tech Wreck (2000-2003) and also for the Financial Crash (2007-2009)); and we are forecasting that, like previously, even though the current rebounds are sharp and sizeable, we are experiencing Lower Highs – notably lower than the All-time Highs around December 2021 through January 2022, documented numerous times – and lower than some other lows. In fact, we think we are at around the appropriate levels for Lower Highs to be put in right about now/here. We could have some large drops and another set of rebounds but not much above current levels – either way, then we expect we will be off to the races for new notable Lower Lows in equities. At some point, we expect an accreleration downwards in equity prices with downlegs notably longer than sharp counter-trend rebounds – This is what happened in previous Equity Bear Markets that we documented.
Bonds – Similarly, the high grade bond market; well, the yield of the U.S. Thirty Year Long Bond traded up and above 5% for the last half of October 2023 (Lower Low in prices) before the current large 20+ basis points rally (new Lower High in price). Most of the curve performed similarly except the short end which saw less movement. As before, we expect yields to now start moving back upwards notably (prices down), especially the long end of the yield curve working toward Un-Inverting the Yield Curve. Most people use the yield of 30 year Long bond to the the Two Year Treasury which is at a 4.94% but we will use the Three Month T-Bill which is at 5.44% to determine if the Yield Curve has a positive slope – that would be “more normal.” So, with the U.S. 30 Year yield currently at 4.81% (Lower High price) it has a notable way to rise in yield (down in price to a new Lower Low).
10-19-2023 – Market Update – This update is going to sound a lot like our Update from last month, except that the forecasted targets were hit but, the new forecast are essentially a continuation of the previous forecasts, all within our long term forecast framework.
Equities – Essentially all equity indices did put in new Lower Lows before rebounding a bit with the most recent new (renewed) “war” before putting in current, new choppy rebounds. Given our Long Term Outlook, we are forecasting more new Lower Lows and we believe eventually (and sooner rather than later) we will see dramatic drops in the equity indices. The leader of this category seems to be High Yield Municipal Bonds (proxy “HYD”), our old specialty! (Clark was the Portfolio Manager of “Vmpax” for 20 years ending mid-2010, which was originally in the High Yield Municipal category, until he moved it into the Short Term category). High Yield Muni proxy, “HYD,” has been dropping the most of the equity and/or equity-like indices we follow compared to previous lows. Following that category is Junk (taxable) bonds (proxy “JNK”), another of our old specialties (Clark was Portfolio of a Junk Taxable Bond fund for a concurrent 8 years). Yes, these are not equities and they do have a very large interest rate component but they are much more risky than high grade bonds – they have risky equity-like credit quality components & they seem to lead equities in the price cycles especially down from the tops. As for “pure” equities, the small caps (proxy Russell 2000, “RUT”) seems to be leading the other equity indices – it has also been heading downwards and seems to be about to break down to a new larger Lower Low. Thus, to us, the trend is down and we are expecting very large notable drops coming soon. Of course, “we will see.”
Interest Rates – As forecast, interest rates have continued to rise with the long end rising faster than the short end. We have been forecasting the reversing of the current yield curve inversion, by the long end trading off (interest rates up) more than the short end & that is what has been happening. In fact, all across the long end of the U.S. Treasury yield curve we are seeing new Record Higher High Yields (since the All-Time record lower lows a couple of years ago. The U.S. Treasury Long bond has seen its yield breach over 5% a couple of times over the past couple of days. We expect continued stair-stepping of yields of longer maturities until the curve is no longer inverted. The U.S. Treasury 3 month bill is currently at 5.42%! so the Long Bond, just to get the yield curve back to “flat” (or level), would need to rise around 42 basis points – We think a 6% Long Bond yield is very likely (and even higher after that).
Real Estate – Long term Housing Mortgage interest rates are now above 8% and we have read that “housing affordability” is the lowest since the late 1980’s – so almost 40 years. They showed a chart of it but it did not go all the way back into the 1970’s when we had the huge inflation that shot the real estate market up before it collapsed down into 1982 (the beginning of the Super Bull Market in Stocks that we think ended in late 2021 – about 3 years ago). I’ve not doubt that homes were very unaffordable at the 1979 real estate peak (that we have documented several times over the years) – we seem to be in a similar situation now.
Commodities – We are less confident on the direction of commodity prices right now, especially precious metals as they have had a bit of a breakout. However, they are largely financed and the cost of financing inventories of commodities has just gone up as we detailed above; thus, we still expect prices to tumble but are less certain.
10-16-2023 – Our Most Recent Tax-Free Performance – Similar to other recent previous months, the short term municipal bond market had another tough month but for the current twelve months, its total return rebounded because the month that dropped off had a more negative total return than the current month. As usual our performance was much more stable. So while the averages caught up a bit for the current twelve months, we are still far ahead for the longer periods.
Stamper Capital & Investments, Inc.
Separately Managed Accounts (National Tax-Free) vs. Tax-Free Municipal Bond Indices
Annual Total Returns, Period Ended 9-30-2023
| PERIOD | Morningstar Muni Short Category Average | SCI Separately Managed Tax-Fee Municipal Accounts Composite Net of Fees | SCI Separately Managed Accounts Net Pre-Tax Equivalent* | Bloomberg Barclay’s 3 Year Tax-Free Muni Bond Index |
|---|---|---|---|---|
| 1 Year | 2.36% | 2.68% | 4.12% | 1.94% |
| 3 Years | -0.43% | 1.75% | 2.69% | -0.95% |
| 5 Years | 0.80% | 2.04% | 3.14% | 0.89% |
| 10 Years | 0.86% | 1.95% | 3.00% | 0.97% |
| 15 Years | 1.42% | 2.25% | 3.47% | 1.73% |
| Since Inception (1/1/1995) | N/A | 3.64% | 5.60% | N/A |
Note: Indices do not have fees (trading costs, custody fees, management fees, etc.) deducted from their returns. We now have a much more reasonable index to compare to – the Bloomberg Barclay’s 3 Year Tax-Free Municipal Index. We still aim for similar or better returns with less risk – The key with this table is that our longer term pre-tax municipal bond returns are noticeably higher than the bond market index but with What We Think is less risk – we will see when rates start to rise and/or credit quality yield spreads widen.
Please see the Disclaimer and Footnotes at the bottom of the page for more information.
* at 35% Federal tax rate
9-24-2023 – Market Update – Equities – The new Lower Lows we mentioned we were looking for in our previous update arrived in essentially all equity indices we follow, with the Russell 2000 and the Dow Jones Transports leading the pack. Junk taxable bonds (proxy “JNK”) have also put in a new Lower Low and are following the High Yield Municipal Bond Market (proxy “HYD”) which seems to be leading all indices. The Housing Market (proxy “IYR”) and the Home Builders (proxy “ITB”) that we have been talking about also put in new Lower Lows. So, to us the current short term trend is downward. We expect new Larger Lower Lows shortly which would make the intermediate term be downward. If that happens we would not be surprised to see an acceleration in the downward trends.
Bonds/Interest Rates – We have recently seen all longer term U.S. Treasury yields put in Higher Highs – the 30 Year just barely and the Ten Year by quite a lot. We had talked previously about the Yield Curve Inversion and that we thought it would be resolved (to a more normal sloping yield curve with longer rates higher than shorter rates) by longer rates rising, not from shorter rates dropping. It looks to us that this breakout (upward in yields) all along the curve is the beginning of that change in yield curve shape. If this is true and long rates continue to go up (as we are forecasting), as we have discussed so many times in these pages, an ultimate impact will be declining prices of all things that are heavily financed which is pretty much everything these days. Of course, we will see.
9-17-2023 – Our Most Recent Tax-Free Performance – The short term municipal bond market, in general, had a slight negative total return for August 2023; however, for the trailing twelve months the returns improved dramatically, as a very negative month dropped off. Our performance was somewhat different with a positive total return for the month & we continued to beat the averages for the twelve months without having such a poor month drop off, because our total returns have, in general, been much more stable and positive. You can easily see how well we have done in the table below.
Stamper Capital & Investments, Inc.
Separately Managed Accounts (National Tax-Free) vs. Tax-Free Municipal Bond Indices
Annual Total Returns, Period Ended 8-31-2023
| PERIOD | Morningstar Muni Short Category Average | SCI Separately Managed Tax-Fee Municipal Accounts Composite Net of Fees | SCI Separately Managed Accounts Net Pre-Tax Equivalent* | Bloomberg Barclay’s 3 Year Tax-Free Muni Bond Index |
|---|---|---|---|---|
| 1 Year | 1.70% | 2.61% | 4.01% | 1.12% |
| 3 Years | -0.18% | 1.77% | 2.72% | -0.58% |
| 5 Years | 0.91% | 2.07% | 3.18% | 1.01% |
| 10 Years | 1.00% | 1.96% | 3.02% | 1.11% |
| 15 Years | 1.38% | 2.23% | 3.42% | 1.72% |
| Since Inception (1/1/1995) | N/A | 3.65% | 5.61% | N/A |
Note: Indices do not have fees (trading costs, custody fees, management fees, etc.) deducted from their returns. We now have a much more reasonable index to compare to – the Bloomberg Barclay’s 3 Year Tax-Free Municipal Index. We still aim for similar or better returns with less risk – The key with this table is that our longer term pre-tax municipal bond returns are noticeably higher than the bond market index but with What We Think is less risk – we will see when rates start to rise and/or credit quality yield spreads widen.
Please see the Disclaimer and Footnotes at the bottom of the page for more information.
* at 35% Federal tax rate
9-5-2023 – Market Update – Equities – We have new Lower Highs in most equity indices around 9-1-2023. We are looking for new Lower Lows. If we get the new Lower Lows we are expecting, then we expect the Bear Market will be resuming in force, unfortunately. The size (spread out nature) of this top has been remarkable – it has taken a long time and is so far very flat. However, we think it will be accompanied by similarly sized price drops which we believe will could be starting soon. The first step will be new Lower Lows (the initial ones of which are not that far away). Over time, the counter-trend rebounds (corrections) will be smaller and the drops will be larger; thus, the decline will accelerate. Of course, we will see.
8-15-2023 – Our Most Recent Tax-Free Performance – The short end of the Municipal Bond Market had a tough July 2023 – rates up pushing prices down and negative total returns “on average” resulting in a drop in their performance for the current twelve months. We actually, did well, picking up just a bit of performance over the periods and still putting a solid performance over all periods reported. Whether we could do this with “size” is definitely a question.
Stamper Capital & Investments, Inc.
Separately Managed Accounts (National Tax-Free) vs. Tax-Free Municipal Bond Indices
Annual Total Returns, Period Ended 7-31-2023
| PERIOD | Morningstar Muni Short Category Average | SCI Separately Managed Tax-Fee Municipal Accounts Composite Net of Fees | SCI Separately Managed Accounts Net Pre-Tax Equivalent* | Bloomberg Barclay’s 3 Year Tax-Free Muni Bond Index |
|---|---|---|---|---|
| 1 Year | 0.94% | 2.53% | 3.89% | 0.05% |
| 3 Years | -0.12% | 1.77% | 2.73% | -0.50% |
| 5 Years | 0.95% | 2.08% | 3.19% | 1.06% |
| 10 Years | 0.98% | 1.95% | 2.99% | 1.14% |
| 15 Years | 1.44% | 2.24% | 3.44% | 1.80% |
| Since Inception (1/1/1995) | N/A | 3.65% | 5.62% | N/A |
Note: Indices do not have fees (trading costs, custody fees, management fees, etc.) deducted from their returns. We now have a much more reasonable index to compare to – the Bloomberg Barclay’s 3 Year Tax-Free Municipal Index. We still aim for similar or better returns with less risk – The key with this table is that our longer term pre-tax municipal bond returns are noticeably higher than the bond market index but with What We Think is less risk – we will see when rates start to rise and/or credit quality yield spreads widen.
Please see the Disclaimer and Footnotes at the bottom of the page for more information.
* at 35% Federal tax rate
7-26-2023 – Market Update – Equities Still Chopping Sideways to Upward & and an Interesting Divergence – Similar to our previous Update, the markets have continued to Chop (up and down) some sideways and some even down a bit and some upwards quite lot. However, essentially all are below their All-Time Highs. The Dow Jones Industrial Average is up to only 2.38% below its All-Time High; the S&P 500 4.2% below; the NASDAQ Comp 12.2% below; the Russel 2000 18.75% below; the KWB Bank Index (“BKX”) is 39.2% below! and, the Dow Jones U.S. Total Stock Market Index is 6.4% below its All-Time High. More interest sensitive categories we track are also down – “JNK” (Junk bond) is 15.8% below its high and “HYD” (High Yield Municipal Bond) is 19.22% below its. Of course, as we have been documenting, interest rates and financing rates are up considerably over the past couple of years (from their All-Time Lows).
We note, as have others, that the rally over the past year is attributable to chiefly only five or six stocks which are reputably in the AI (Artificial Intelligence) arena. This attributable is why the narrower NASDAQ 100 is only 5.77% below its All-Time High while the broader NASDAQ COMP is 12.2% below its All-Time High. It also accounts for the very strong recent showing in the Dow Industrials and in the S&P 500, as compared to other categories without those AI stocks. Markets that shoot up with very narrow breadth like we are seeing usually are putting in major market tops – this makes sense to us in these markets.
Given the Dow Industrials is now so close to its All-Time High, we would not be surprised for it to put in a new one, while we expect most indicies will not. That would be a major “divergence” which is what is generally seen at major market tops.
Ok, the Interesting Divergence we have been following for a few months now is the differing performance of general real estate ETF’s (“IYR”) and home building ETF’s (“ITB”). IYR is 22.9% below its All-Time High while recently ITB has shot up to a New All-Time High! Wow – what a divergence. We think it will be interesting to see how this resolves.
We believe the markets that haven’t topped recently could top at any time, and soon the markets will see a resumption of their declines, including accelerations downwards in their prices. The large sizes of the divergences, in terms of price and time, to us, are indicative of how large the downturns in price and time will be. Accordingly, we think the upside is minimal and the downside is very large.
+++++++++++++++
Please go to our previous blog, The Beginning of the Super All-Everything Top – First Peak, to view previous “real time” market discussion.