|
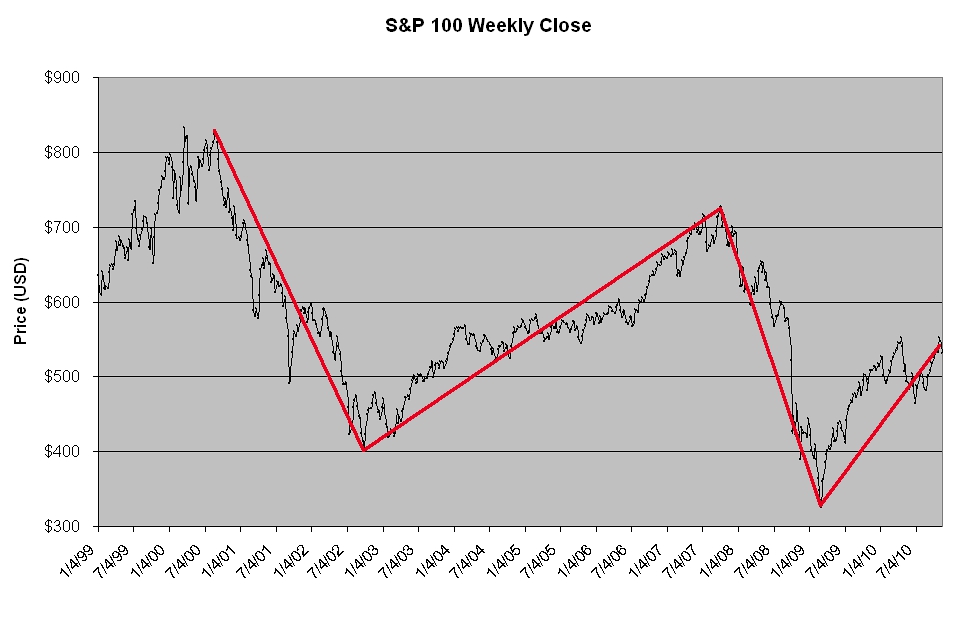
Stamper Capital & Investments Forecasts Become Reality November 18th, 2010Over the past decade, Stamper Capital & Investments’ President and Portfolio Manager, B. Clark Stamper, has been forecasting the overall US economic movement to follow the shape of a right-tilted ‘W’, with the right leg lower than the left leg. This has been referred to in many of his Annual Forecasts, see the articles here: 2004, 2006, 2009, & 2010, and was first fully described in 2nd Quarter 2002 in the article titled “’W’ hat The Economy Might Look Like”, the Stamper Capital & Investments former newsletter The Wealth Preserver. The “right-tilted ‘W’” does not obviously appear in every index, but as can be seen in the S&P 100 below it is clear, and if you measure other indices with a basket of currencies instead of only the US Dollar (to adjust for inflation), it is easily seen.
This pattern has been apparent over the past decade, almost exactly as Stamper forecasted back in 2002, and we expect it to continue in this manner until around 2016, when the cycle finally puts in a substantial bottom and moves to a long slow upward phase. Alas, we also do not believe the pattern has ‘bottomed’ yet, and still has quite a ways to go down before a recovery can begin. While we do not think we can pinpoint the exact bottom in advance; “we think we will know when we get there.”
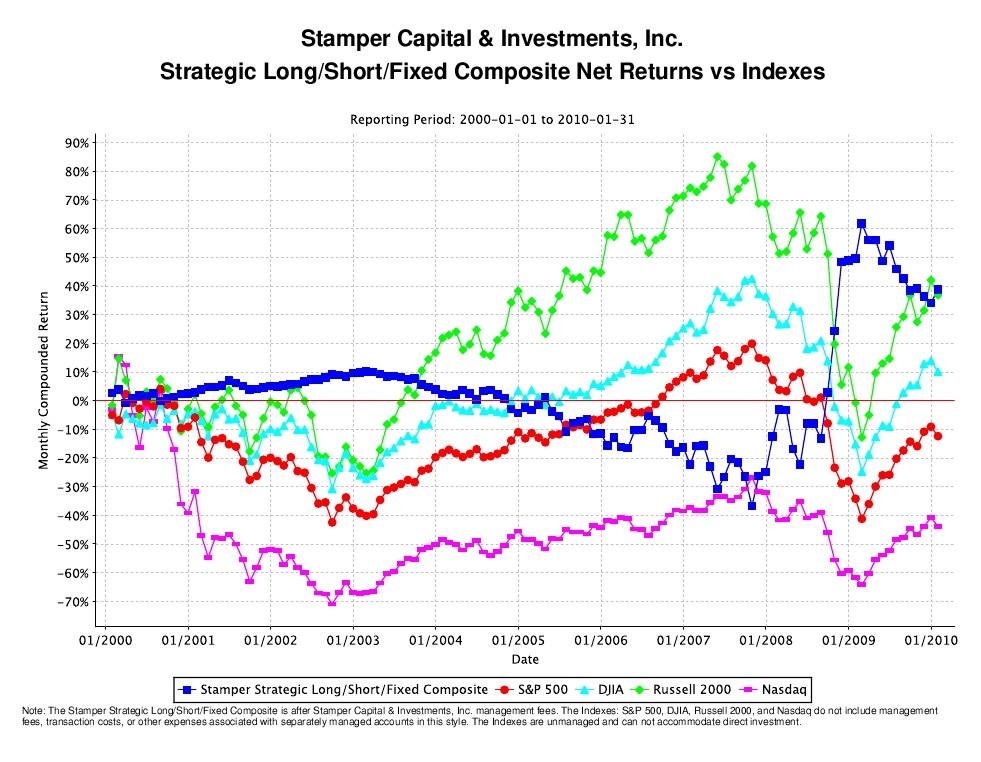
The ‘W’ shape is comprised of a series of bull and bear cycles, each with a lower maximum and minimum level than the next, in an overall downward pattern. Tracing the shape of a ‘W’, the markets will begin from an ultimate high point, like the top of the tech bubble, and head down in a bear market for a period of months (or years), as the left downward leg of the ‘W’. Then it will go into a bull market, headed up, usually not surpassing the beginning high point of the first leg down, (although as in the housing bubble this was not the case, but it still followed the overall pattern), partially retracing the prior high. This is followed by the second bear market leg down from the middle top of the ‘W’ shape, which dips even further below the first low point of the first leg down. Once again, the bear market is followed by a bull market; headed up to another partial retracement of the first bull market, but not fully recovering anywhere near its original high point. We believe this downward ‘W’ is part of a larger cycle in the great scheme of things (1999/2000 to around 2016), and as we have shown, what goes up must come down if it is predicated on easy credit. The reason for this long-term forecast is due to massive over-valued asset prices and credit abuse that took several decades to inflate. It began its path back down to reality when the tech bubble burst, and should hopefully be at the appropriate level around 2016. That is when we believe the housing (and pension) mess will finally be unwound; at that time market prices should present lifetime bargains as a correction almost always overshoots, this time in the downward direction. It turns out that although Stamper’s forecasting was a bit early it was still correct. The economy is indeed worse off than it was ten years ago, with no signs of improvement in the short-term future. Stamper originally forecast the top of the market in our January 2000 Market Comment, and said that “Safety is the Watchword for the Decade” in the 3Q2001 Wealth Preserver, and numerous times annually subsequently (see Annual Forecasts). The March 2009 bottom was the down leg from the middle of the right-tilted ‘W’, and the following rebound fulfilled our forecast, but we do not believe it was the ultimate bottom – we think this cycle is not yet finished. After the next leg down, which will be noticeably lower than March ’09, there will be a long-lasting recovery years from now, albeit at a much lower standard of living than we were been used to in the past decade. Please see our January 2010 Market Comment. Besides performing very well in our municipal bond accounts during 2008 (see Stamper's 20-Year Run), we were also very well positioned for our forecast in our Stamper Strategic Long/Short/Fixed Composite, which in 2008 had positive performance of nearly 98%, while the S&P lost –37% and the NASDAQ lost –39%.
Notice how our composite (in dark blue) moved opposite the major indices. Please see our prior article, “Interview with Portfolio Manager, Clark Stamper: How did the Stamper Strategic Long/Short/Fixed Composite achieve a total return of 98% for year 2008?, for more details about how we accomplished this.Until around 2016, we believe there will be a difficult period of economic and social pain, rivaling or surpassing the Great Depression, which could potentially lead to the debasement of our currency and another war. But once we get past all of this; once we have taken our medicine, we forecast there will be decades of growth (or re-building) not unlike what our country experienced after WWII, yielding fantastic opportunities for those prepared to weather the current storm. Stamper Capital & Investments has been positioning our clients over the past several years in preparation of what we are forecasting. If we are right, the past two years will seem like a walk in the park compared to what is coming. We intend our clients to not only just ‘survive’ what is to come, but to be in a position to make once-in-a-lifetime investments at fire-sale prices. If you are interested in discussing our forecast further or would like to inquire about privately managed municipal bond accounts, please contact Stamper Capital & Investments at (949) 673-5787 or email us at separatelymanagedaccounts@risk-adjusted.com.
---------------------------------------------------------------------------------------- Stamper Capital & Investments, Inc. provides portfolio management services exclusively for institutional and high net worth accounts and does does not sell the mutual funds for which it is a sub-adviser. Also, please note: purchasers of mutual funds must receive a copy of a particular mutual fund's prospectus before a purchase is made. Stamper Capital & Investments, Inc. has been the sub-adviser to this Fund since October 1995 and B. Clark Stamper, our President, has been its Portfolio Manager since June 1990. Past performance does not guarantee future results, and current performance may be higher or lower than the performance data quoted. Investment return and principal value of an investment will fluctuate so that investor's shares, when redeemed, may be worth more or less than their original cost. Returns - Figures quoted are total returns calculated for the share class and time periods shown. Performance includes the reinvestment of income dividends and capital gains distributions. Performance does not reflect the deduction of taxes that a shareholder would pay on a fund distribution or the redemption of fund shares. Please go to Morningstar's and/or Lipper's websites for more information. Please see the our Disclaimer link on the bottom left of this page for more information about risk and return.
|
 ‘W’hat Goes Up Must Come Down: