|
Interview with Portfolio Manager, Clark Stamper: How did the Stamper Strategic Long/Short/Fixed Composite achieve a total return of 98% for year 2008? March 5th, 2010
Stamper
Strategic Long/Short/Fixed Composite
|
|
PERIOD |
S&P 500 |
Russell 2000 | Dow Jones Industrial Average | NASDAQ | Stamper Strategic Long/Short/Fixed Composite |
| Year 12-31-2008 | -36.999 | -33.788 | -31.926 | -39.981 | +97.931 |
| 3 Years* | -7.237 | -7.741 | -4.649 | -3.607 | +21.301 |
| 5 Years* | 0.177 | 0.642 | 1.791 | 1.675 | +7.280 |
| 10 Years* | -0.803 | 3.351 | 1.466 | -5.303 | +3.062 |
Note: Indices have no fees, nor trading
costs
"Stamper Strategic Long/Short/Fixed Composite" returns are after 1% annual management fees.
Q. How did you get a 98% return during the worst market crash in decades?
A. The short answer is that we were correctly positioned in our Stamper Strategic Long/Short/Fixed Composite similar to how we were correctly positioned in the Evergreen Strategic Municipal Fund (VMPYX) that we simultaneously managed.
We were positioned for the credit contraction considered by most as a “Black Swan”. We let our performance do the talking, however the comments and forecasts on our website accurately predicted this event. See the Annual Forecasts and Articles section on our website, www.risk-adjusted.com.
The following is a table showing the performance of the Evergreen Strategic Municipal Bond Fund for the period ending September 30, 2008, one of the worst months for the municipal bond market on record:
Lipper Rankings
General Municipal Bond Funds
Period Ending September 30, 2008
|
PERIOD |
Stamper Capital Sub-Advised Fund RANK |
NUMBER OF COMPETITORS | Muni National Short CATEGORY AVG. TOTAL RETURN | Stamper Capital Managed Strategic Municipal Bond Fund TOTAL RETURNS | Fund PRE-TAX EQUIVALENT TOTAL RETURNS | Stamper Capital Managed Fund Share Class |
| 1 Month | 1st | 246 | - 5.38% | - 1.16% | - 1.16% | I |
| YTD | 1st | 235 | -5.23% | + 0.82% | +1.26% | I |
| 1 Year | 4th | 232 | - 4.83% | + 1.75% | + 2.69% | I |
| 3 Years | 1st | 213 | 0.32% | 3.04% | 4.68% | I |
| 5 Years | 5th | 204 | 1.73% | 3.13% | 4.82% | I |
| 10 Years | 29th | 149 | 2.98% | 3.60% | 5.53% | I |
The pre-tax equivalents
are based on the highest federal tax bracket of 35%.
"Rank" is
absolute so for the five years the Fund's percentile is 5/204 or the 2nd
percentile!
Q. Looking at the table, obviously the fund was positioned very well for the downturn, but how did the "Stamper Strategic Long/Short/Fixed Composite" do, and what type of composite/account is it?
A. It is a composite of separately managed accounts with the freedom to go long or short on equity-risk level investment vehicles.
The following chart contains the Stamper Strategic Long/Short/Fixed Composite's annual total returns for the prior decade, as well as the monthly return for January 2010:
Stamper
Strategic Long/Short/Fixed Composite
Total Returns Annualized
|
PERIOD |
S&P 500 |
Russell 2000 | Dow Jones Industrial Average | NASDAQ | Stamper Strategic Long/Short/Fixed Composite |
| Month 1-31-2010* | -3.57% | -3.68% | -3.322% | -5.337% | +3.468% |
| Year 12-31-2009 | 26.465 | 27.173 | 22.681 | 45.36 | -9.861 |
| Year 12-31-2008 | -36.999 | -33.788 | -31.926 | -39.981 | +97.931 |
| Year 12-31-2007 | 5.494 | -1.557 | 8.878 | 10.658 | -10.202 |
| Year 12-31-2006 | 15.792 | 18.445 | 19.043 | 10.390 | -5.516 |
| Year 12-31-2005 | 4.909 | 4.625 | 1.718 | 2.127 | -7.468 |
| Year 12-31-2004 | 10.878 | 18.435 | 5.309 | 9.152 | -7.880 |
| Year 12-31-2003 | 28.685 | 47.291 | 28.288 | 50.776 | -5.109 |
| Year 12-31-2002 | -22.100 | -20.465 | -15.015 | -31.238 | +4.303 |
| Year 12-31-2001 | -11.885 | 2.632 | -5.439 | -20.805 | +2.434 |
| Year 12-31-2000 | -9.106 | -2.912 | -4.717 | -39.180 | +2.506 |
*January 2010 not annualized. Also Note: Indices have no fees, nor trading
costs
Stamper Strategic Long/Short/Fixed Composite returns are after 1% annual management fees.
Q. Wow, so for 2008, the Stamper Strategic Long/Short/Fixed Composite returned +97.931%, and the stock indices had negative returns of -32% to -40%. It also looks like your returns had less downside volatility over the years.
A. One can see from the table that the worst year for the Stamper Strategic Long/Short/Fixed Composite was far short of the worst years experienced by the equity indices, about one third of their worst loss. In fact, each equity index reported two or more years with a larger negative return than the worst year of the Stamper Strategic Long/Short/Fixed Composite. For example, in 2007 the Stamper Strategic Long/Short/Fixed Composite dropped 10.202% whereas the S&P 500 declared losses of 36.999%, 22.100%, and 11.885% during the decade. The Stamper Strategic Composite achieved a superior performance, especially on a risk-adjusted basis.
Here is a chart of the returns to visualize more easily:
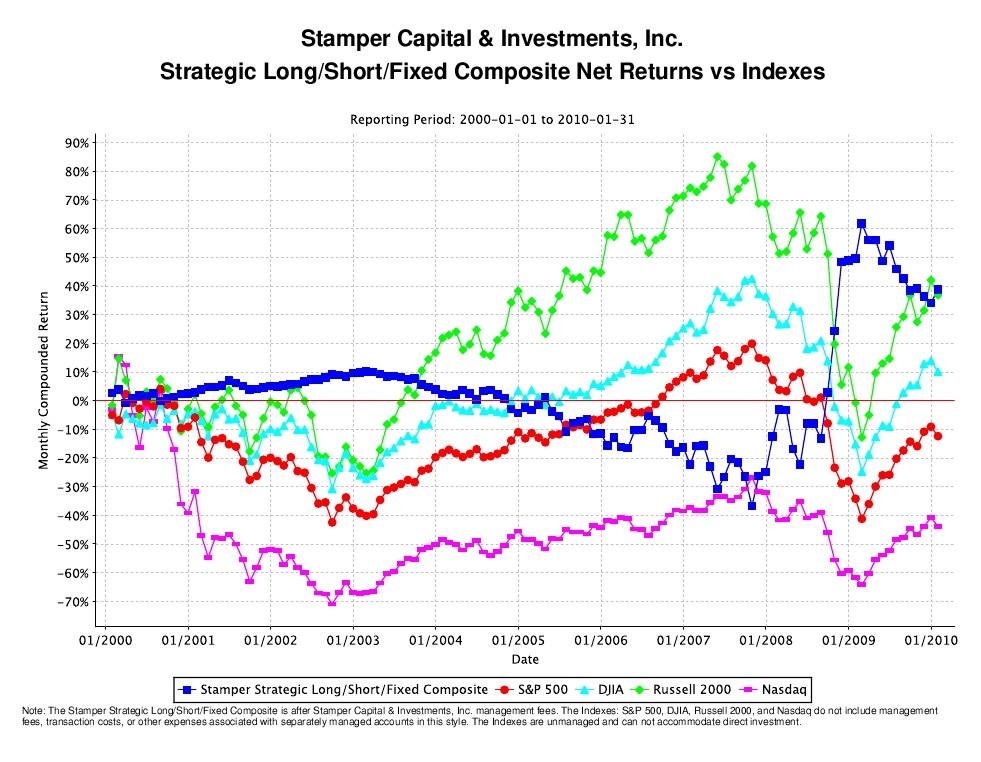
The graph shows that the Stamper Strategic Long/Short/Fixed Composite effectively had a negative correlation with the equity markets. From 2000 through 2002 the indices were considerably more negative that the Stamper Strategic Composite was positive and from 2003 to 2007 the indices were substantially more positive than the negative returns experienced by the Stamper Strategic Long/Short/Fixed Composite. In 2008 our patience paid off as the Stamper Strategic Long/Short/Fixed Composite picked up more than two-times what the indices dropped.
The following table shows the ending results over time:
Stamper
Strategic Long/Short/Fixed Composite
Period Ending January 31, 2010
|
PERIOD |
S&P 500 |
Russell 2000 | Dow Jones Industrial Average | NASDAQ | Stamper Strategic Long/Short/Fixed Composite |
| 1 Month | -3.597% | -3.681% | -3.322% | -5.337% | +3.468% |
| 3 Months | 4.159 | 7.340 | 4.358 | 5.281 | -0.239 |
| 6 Months | 9.866 | 8.857 | 11.300 | 9.054 | -4.933 |
| 1 Years | 33.137 | 37.819 | 29.831 | 46.932 | -7.168 |
| 3 Years* | -7.237 | -7.741 | -4.649 | -3.607 | +21.301 |
| 5 Years* | 0.177 | 0.642 | 1.791 | 1.675 | +7.280 |
| 10 Years* | -0.803 | 3.351 | 1.466 | -5.303 | +3.062 |
Period returns are
calculated by compounding monthly returns.
Returns are not annualized, unless period is marked with an *.
Note: Indices have no fees, nor trading
costs
Stamper Strategic Long/Short/Fixed Composite returns are after 1% annual management fees.
Q. We have clearly seen the results, how were you able to perform so well?
A. Well, if you read our Annual Forecasts, we essentially called the top of the stock market in 2000. Confident in our forecasts we placed some shorts on a few stocks. While the call was correct, our positive out-performance was somewhat muted due to the percentage of money market and fixed income assets held in the portfolio.
In anticipation of a rebound, we covered most of our shorts near the bottom of the market in 2002. Instead of going long we chose to stay on the sidelines “clipping coupons” (Collecting interest payments from the bonds and other fixed income holdings in the portfolios).
After a substantial rally in the equity market after the 2002/2003 bottom, we began putting shorts back on. As I remember, we put a short on near several of the market highs starting in late 2003 and again in late 2004. The higher the equity markets went, the more shorts we placed.
We kept most of our powder dry (waited patiently) until we began noticing confirmation that the economics were getting worse. The upside potential of stocks was evaporating and the downside potential was growing. We were using an inverse version of our “upside potential/downside protection analysis”.
While we had long predicted a credit contraction and a downturn in the economy and risky assets, experience has taught us that market prices can lead and lag reality by years (recall the tech rally into the 2000 top). We were closely watching for key events that had a chance to make the market move in our forecasted direction. In early 2007 we decided the downside potential was increasing due to the negative developments in Bear Stearns' Collateralized Debt Obligations (CDOs). We were also closely monitoring the municipal bond insurers that had entered into the CDO market. In mid 2008, we became more aggressive as we saw continuously growing problems in both the economy and the markets.
The key reason we performed so well in 2008 (earning more than two-times what the indices lost) was that our confidence rose sharply and we increased the percentage of shorts in our portfolios. We then covered all of our shorts near the November 2008 low. If you recall, the 2008 low for the Dow Jones Industrial Average was on 11-20-2008; From there the Dow rose 16% to the end of the year before dropping again to put in a new low in March of 2009.
Q. What securities were you using in the Stamper Strategic Long/Short/Fixed Composite?
A. Stamper Capital took advantage of a wide range of vehicles. Most of the returns came from shorting Exchange Trade Funds (ETFs) and stocks. We also used a few options, however with premiums so high we decided the risk/reward ratios on these were poor. We also went long on Short and Double Short ETFs, funds that aim to capture the daily inverse or two-times the daily inverse of an index respectively. The vehicles we chose were based on our expected holding period and our confidence level. One reason we performed so well in 2008, earning more than two-times the loss of the equity indices listed in prior tables, was that we loaded up on Double Short ETFs near the 2008 highs.
One excellent call was early in 2005 when we placed shorts on four home builders. The home builder sector topped and turned down earlier than most other sectors. The returns from these shorts helped offset negative returns caused by going short too early in other areas. For example, our largest error was shorting Google far too early. Despite this, Stamper Capital still made a profit covering the Google short near the November 2008 low.
All of the shorts made in the Stamper Strategic Long/Short/Fixed Composite would have yielded a positive return if it were not for dividends; When you short a stock or ETF you must pay any declared dividends, however if you are long a Short or Double Short ETF you could earn dividends. The vast majority of our holdings did produce a positive return, even though some may have had a negative return on paper (unrealized) at times during the holding period.
At times, we maintained large cash balances. Early on, cash was kept in money markets, and later was placed in high quality tax-free bonds. Adjusted for taxes, our returns would be even higher than the indices on a relative basis due to tax-free income. The Stamper Strategic Composite was focused on taking advantage of large downside potential of risky assets. Stamper Capital has taken advantage of the downside potential in a wide array of categories including: Transportation, Technology, Energy, Homebuilders, Precious Metals, Large Caps, and Small Caps.
Q. What do you plan to do differently going forward?
A. In the future, we would be reluctant to buy Double Long ETFs. These vehicles could fail if they experience too many redemptions, causing them to lose track of their benchmark indices. Vehicle failure is not a problem if going Short a Double Long ETF, as we would still win if that ETF failed because it's value would drop. An even better choice than shorting a Double Long ETF is to be in a Double Short ETF. This is because if the market moves in your direction, your investment is automatically compounded increasing the amount you have invested and your return.
Q. Does managing municipal bonds help your management of risky assets and vice versa?
A. Stamper Capital's upside potential/downside protection analysis and implementation works well for all investment categories. Since 1984, I have managed four different institutional mutual funds in three different categories: U.S. Treasuries and Mortgage Backed Securities (MBS), junk (high-yield) taxable bonds, and high yield/high grade municipal bonds. In the early 1980's, I personally traded a large amount of index options and was successful there as well. (see Portfolio Manager Resume and our Articles section). The upside potential/downside protection model has worked well in all of these categories. Our Annual January Forecasts are based on this methodology. You can read them on the website, www.risk-adjusted.com. We believe that they have been more accurate than most forecasters.
Q. Anything else of significance related to all of this?
A. Yes. We are very cautious on the "recovery." Please read our January 2010 Annual Forecast. Anyone interested in account management with Stamper Capital & Investments, Inc., can see the High Net Worth Accounts section of our website for more information.
----------------------------------------------------------------------------------------
Stamper Capital & Investments, Inc. provides portfolio management services exclusively for institutional and high net worth accounts and does does not sell the mutual funds for which it is a sub-adviser. Also, please note: purchasers of mutual funds must receive a copy of a particular mutual fund's prospectus before a purchase is made.
Stamper Capital & Investments, Inc. has been the sub-adviser to this Fund since October 1995 and B. Clark Stamper, our President, has been its Portfolio Manager since June 1990.
Past performance does not guarantee future results, and current performance may be higher or lower than the performance data quoted. Investment return and principal value of an investment will fluctuate so that investor's shares, when redeemed, may be worth more or less than their original cost.
Returns - Figures quoted are total returns calculated for the share class and time periods shown. Performance includes the reinvestment of income dividends and capital gains distributions. Performance does not reflect the deduction of taxes that a shareholder would pay on a fund distribution or the redemption of fund shares. Please go to Morningstar's and/or Lipper's websites for more information.
Please see the our Disclaimer link on the bottom left of this page for more information about risk and return.