Clark Stamper Completes a Superior 20-Year Run Managing the Former Evergreen Strategic Municipal Bond Fund; Provides Top-Notch Returns Over Last Decade for Little Risk!
Stamper Capital & Investments, Inc. President and Portfolio Manager, B. Clark Stamper, managed the Evergreen Strategic Municipal Bond Fund for twenty years, from June 1990 to June 2010. In fact, Clark Stamper managed that fund longer than 94% of his peers manage their mutual funds – he had the 10th longest tenure out of 161 competing funds! The average tenure for a municipal bond manager is just 8.33 years, and Clark Stamper managed for 20.10 years - see graph below. He was even able to achieve a high level of return for a low level of risk using his proprietary upside potential, downside protection methodology over the most challenging financial conditions our country has seen since the Great Depression.
Bar Graph #1
The following charts show the Annualized Total Annual Return (before fees) for national tax-free municipal bond funds over the past 3, 5, and 10 years, in relation to a fund’s Standard Deviation (S.D.), which is a measurement of risk – the higher the S.D. the higher the risk, the lower the S.D. the lower the risk.
Stamper was able to produce a high level of return for a low level of risk when compared to virtually all municipal bond fund categories, including High Yield, Short, Intermediate, and Long term. The only open-ended U.S. tax-free mutual funds excluded from this analysis are money market funds, ultra short funds (which have duration of 1.5 years or less), and single state tax-free municipal bond funds. The Evergreen Strategic Municipal Bond Fund defied placement in any category, because it competed against them all.
Chart #1
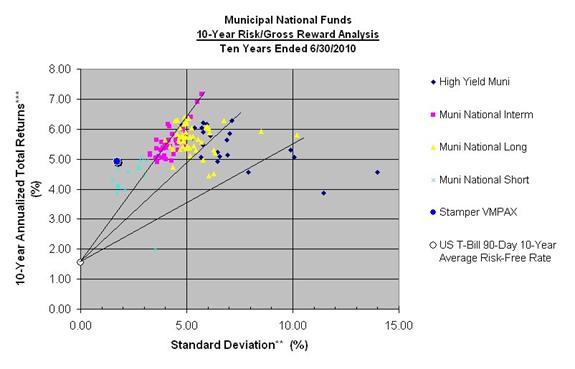
This chart shows that the Evergreen Strategic Municipal Bond Fund (Ticker: VMPAX) achieved a 4.91% return over a 10-year period (June 2000 to June 2010) – that is a pre-tax return of 7.55% at the 35% federal bracket. During that same 10-year period, the 90-day t-bill had an average return of 1.55%, which is the risk-free rate. Stamper took very low risk compared to his peers, especially in the Long and High Yield categories to achieve the same rate of return.
Chart #2
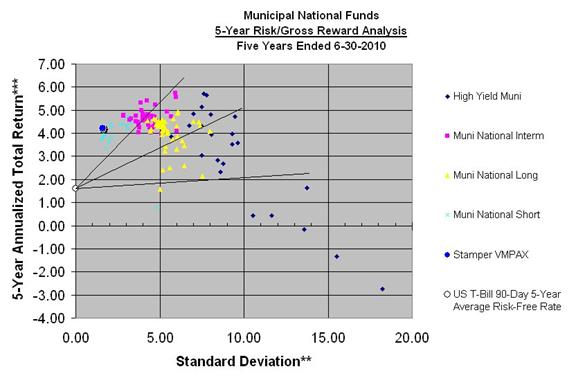
Over the 5-year period, Stamper was able to provide a 4.21% return for shareholders of VMPAX before fees, which is equivalent to a 6.48% pre-tax gain on a taxable equivalent investment vehicle. The risk-free rate for that period was only 1.59%, and nearly every competitor had to take far more risk to provide comparable returns (some took too much, as can be seen in the high-yield category).
Chart #3
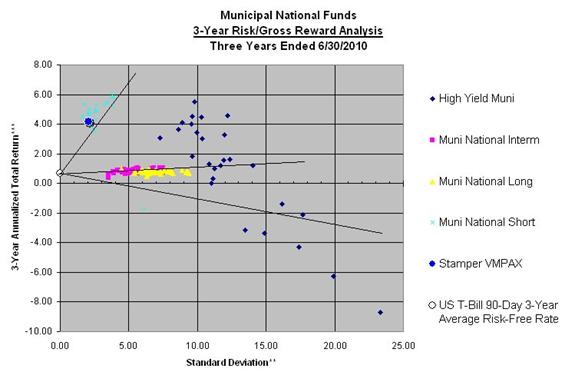
The Evergreen Strategic Municipal Bond Fund still outperformed during the most challenging three-year period from June 2007 to June 2010 since the Great Depression, taking vastly less risk than the competition. VMPAX earned a 4.18%, or 6.43% pre-tax return when the majority of the competition did not earn better than the risk free rate of 0.67%. Stamper proved during these difficult market conditions that he provides a vastly superior management level than the majority of muni fund managers out there.
As you can see, Stamper Capital & Investments provided a fantastic return for the level of risk to hundreds of investors of the Evergreen Strategic Municipal Bond Fund for the past ten years.
Now, Stamper is able to offer this same strategy to you, the individual investor, in your own privately managed municipal bond account. You also get the added bonus of being able to keep your bonds at the custodian bank of your choice, lower fees than the mutual fund would charge, direct access to the Portfolio Manager, and no redemption risk from other shareholders because you are the only owner of your account! Contact Stamper Capital & Investments today to get started.
Definitions:
Total Return: The actual return on an investment. This includes income earned on an investment as well as appreciation or depreciation of that investment. In this article, we report total return on funds before expenses are deducted. This is in order to show actual performance of the Portfolio Manager before the fund administration and other fees handicap performance.
Standard Deviation: A measure of risk. The higher the Standard Deviation, the more fund performance varies from its mean monthly total return over the respective period, which in this case, is over the prior 10 years. The higher the Standard Deviation, the higher the risk.
Risk-Free Rate: In this article, we use the 90-Day US T-Bill average yield for the 3, 5, and 10 year periods after taxes of 35% are deducted. This is because all of the funds we are using for comparison are federal tax-free. If a high net worth investor were to put their money into a T-Bill instead of VMPAX, they would have to pay a 35% tax, whereas had they been invested in VMPAX, that would not apply.
Risk-Adjusted Performance: This shows performance of an investment while accounting for the amount of risk that investment takes in order to create that level of performance. Many asset managers talk about the higher the risk, the higher the return, but they do not mention that more risk is like gambling, and there are outlying portfolio managers that can produce good (or even excellent) total returns for much lower risk (like Stamper has shown in this study). Also, as for measured performance of mutual funds, many of the poorer performing funds are either closed or merged away. This "survivorship bias" is why there are more competitors in the three and five-year categories than there are in the ten-year categories (see next definition). Thus, you are seeing the best of the best.
Mutual Fund Categories: When defining competing funds into their respective categories, we used their own definitions of their respective funds. This is mainly because all of their prospectuses may have different guidelines. For the time-period the data was compiled, VMPAX was classified in the short category, though this has varied over the years. Below is a table showing the number of competing funds in each category used in the analysis for the various periods.
|
|
Short |
Intermediate |
Long |
High yield |
Total |
|
3-Year |
20 |
45 |
50 |
27 |
142 |
|
5-Year |
18 |
44 |
50 |
23 |
135 |
|
10-Year |
15 |
40 |
48 |
22 |
125 |
DISCLAIMER:
Stamper Capital & Investments, Inc. provides portfolio management services exclusively for institutional and high net worth accounts and does not sell the mutual funds for which it is or was a sub-adviser. Also, please note: purchasers of mutual funds must receive a copy of a particular mutual fund's prospectus before a purchase is made.
Stamper Capital & Investments, Inc. was the sub-adviser to this Fund since October 1995 and B. Clark Stamper, our President, was its Portfolio Manager since June 1990. The contract to manage the fund ended in July 2010 – Stamper Capital & Investments and Clark Stamper no longer manage the fund.
Past performance does not guarantee future results, and current performance may be higher or lower than the performance data quoted. Investment return and principal value of an investment will fluctuate so that investor's shares, when redeemed, may be worth more or less than their original cost.
Returns - Figures quoted are gross total returns calculated for the share class and time periods shown. Performance includes the reinvestment of income dividends and capital gains distributions. Performance does not reflect the deduction of taxes that a shareholder would pay on a fund distribution or the redemption of fund shares. Please see the Disclaimer link on the bottom left of this page for more information about risk and return.