Stamper Capital & Investments, Inc. Portfolio Management Tops the Tax-Free Municipal Competition Across FOUR Categories Over Three, Five, and Ten Year Periods:
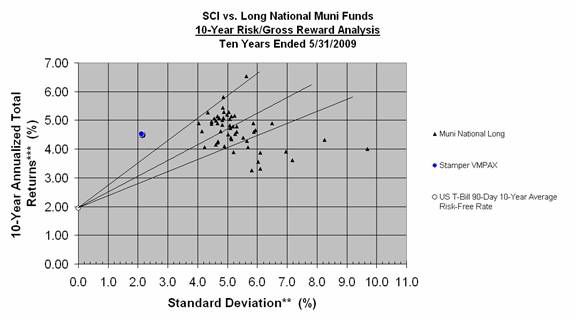
Chart # 1
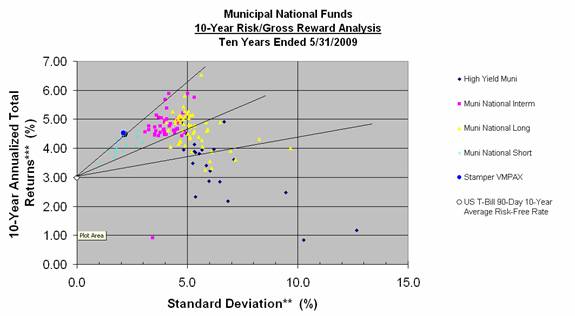
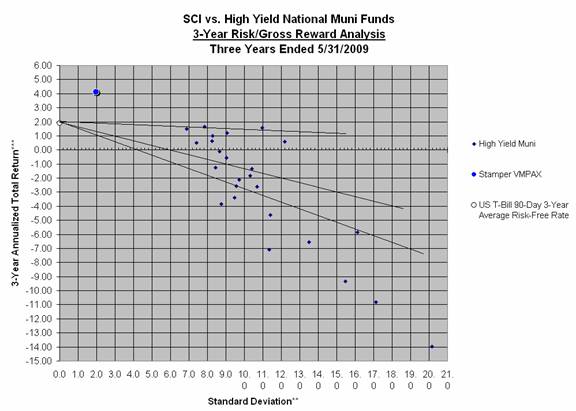
Quick Analysis: Higher up and to the left is considered the risk-adjusted performance winner because it represents the most return for the least risk.
We’ve included risk-adjusted performance lines (from the risk-free rate) to aid in seeing who the top performer is.
The analysis includes all short term, intermediate term, long term, and high yield/high credit risk open-ended, U.S tax-free municipal bond funds (see Appendix for more detailed information, definitions, and more detailed graphs). To determine the “best risk-adjusted Portfolio Manager,” returns are “gross” or before fees; investors’ returns would have varied by amount of actual fees incurred. Also, as always, past performance does not guarantee future results (see disclaimer below).
To make the analysis even more reasonable, reliable, and useful, we analyzed at the data over three periods: three years, five years, and ten years ending 5-31-2009.
What does this graph tell us?
The graph is a scatter plot of all the open-ended U.S Federal tax-free mutual funds’ annualized total returns versus the standard deviation of those returns. Standard deviation is used as a proxy for risk experienced during the period. See the Appendix for more detailed information.
Are “risk-adjusted returns” considered a better performance measure than “absolute performance?”
Simply looking at “absolute returns” ignores the risk that was taken to achieve them. Recall during the tech bubble those high flying, high tech internet funds with the best returns through 2000 seemed to clearly have the best overall performance. However, a few years later most of those funds had blown up, piling huge losses; several were even closed down. This is an extreme example but makes the point. We believe considering the risk that is taken on or experienced is the most professional way to analyze performance. To cover all the bases, note that not all competitors were necessarily trying to achieve a superior risk-adjusted total return as Stamper was.
What about Portfolio Manager Tenure of the mutual funds?
Stamper Capital’s Portfolio Manager, Clark Stamper, has managed the Evergreen Strategic Municipal Bond fund since June 14, 1990, so for 19 years for the period ending May 31, 2009 (and since 1995 with Stamper Capital & Investments, Inc. as the Fund’s sub-adviser). Any Portfolio Manager tenure of 20-years (as of June 2010) is certainly significant and unusual. Unfortunately, if we were to take out funds with Portfolio Manager tenure of less than the ten years, or even less than five or three years, the pool of competitors would shrink dramatically; hence, even with the lack of continuity in other fund’s portfolio management, we have included mutual funds regardless of their lack of Portfolio Manager tenure.
Why include all the different categories: short term, intermediate term, long term, and high yield (high credit risk) to determine who is the best?
These categories are included in order to verify which areas generally performed best over the three periods. The risk-adjusted scatter plot points represent each mutual fund’s total return versus risk. Each different style of point represents a different category – see the legend.
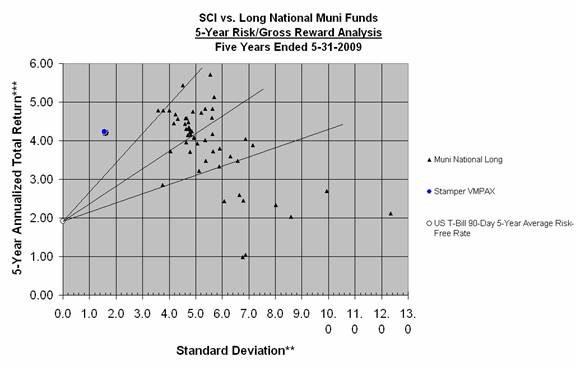
Because we performed the analysis over three different period lengths you can see that certain categories did better than others over the different periods. For example, you can see that high yield/lower quality funds did poorly as a group over the past five years (Chart #2, below); the short-term funds, on average, did the best. In comparison over ten years (see Chart #1, above), risk-adjusted performance between the groups was more uniform; however, the intermediate funds outperformed the long term and the high yield/lower credit quality funds.
Chart # 2

We are highlighting the performance of each individual fund in addition to the performance of the categories, which you can see by the shapes and the colors – that way you can see both categories and individual funds.
Obviously, our main point is that Stamper managed VMPAX achieved top risk-adjusted performance verses all four categories: short term, intermediate term, long term, and high yield/lower quality over all three periods analyzed: three years, five years, and ten years ending 5-31-09. Not only did Stamper pick the correct category to be invested in versus all four categories over all three-time periods, Stamper also achieved superior risk-adjusted performance versus the top-performing category for each time period analyzed.
What is the significance of Stamper’s superior risk-adjusted performance?
Most funds are “stuck in the box” – that is, the Portfolio Manager is limited to stringent investment restrictions; however, some have more wide-open Prospectuses and/or more investment latitude. Stamper managed Evergreen Strategic Municipal Bond Fund (VMPAX) has very few limitations. It can be 100% below investment grade up to 100% pre-refunded in U.S. Treasuries, from completely non-rated to completely AAA-rated, and it has no maturity or duration (a measure of interest rate risk) limits, and not required to be short or long.
With autonomy comes increased responsibility, as well as the ability to add value by being correctly postured in the best area during a particular investment period (that is, if the Portfolio Manager knows what they are doing). For example, VMPAX could have been 100% invested in high yield/junk Muni’s over the past three years. Over that period high yield municipal bonds as a group very obviously had the worst returns (see Chart #3, below). Stamper very well could have had VMPAX positioned entirely in high yield/low quality municipal bonds that fared so poorly. (Please visit Interview With Portfolio Manager to see how he positioned correctly to avoid the 2007-2009 credit and liquidity implosion). In fact, Stamper had VMPAX positioned with an average rating of BB and 45% non-rated back in the early 1990’s when high yield bonds were the top performing municipal bond fund category (remember Stamper has been the Portfolio Manager of this Fund since June 1990). Please go to our Articles and Performance Sections to see how we had similar superior risk-adjusted performance since 1990.
Chart # 3

On the other hand, over the past few years (Chart #3, above), muni bonds with short durations and the highest credit quality obviously performed the best. Stamper had VMPAX positioned largely in this area, in part explaining its superior performance versus high yield, long maturity, and intermediate maturity bonds, and funds positioned as such. However, the Stamper-managed VMPAX also achieved a superior performance in the category, which had the best performance in general, over the three, five, and ten year periods.
Was it just being in the right category: short term, intermediate term, long term, or high yield that contributed to VMPAX’s superior risk-adjusted performance?
Of course, correct positioning along those lines is very important; however VMPAX also produced superior risk-adjusted performance within the category (ies) that performed the best for the time periods analyzed. Thus, we believe that there is more to it than just picking the correct category. The flexibility the manager has over the portfolio construction allows him to jump into and out of the best-performing categories as needed.
There are numerous articles on www.risk-adjusted.com that explain Stamper’s proprietary “upside potential/downside protection” strategy, focus and implementation.
Stamper has applied these techniques and strategies to other investment categories besides municipal bonds as well, including corporate bonds and mortgaged backed securities (MBS), for which he was also an open-end Portfolio Manager (also on www.risk-adjusted.com). Most recently Stamper has posted an article on its application to the equity markets (see Interview With Portfolio Manager).
In short, Stamper focuses on the upside potential and downside protection of each individual bond in the portfolio relative to security characteristics (the bond’s coupon size, maturity date, call structure, sinking fund structure, etc.) and to credit quality characteristics (the security, position in the capital structure, quality of the cash flows backing the bond, various debt levels of the issuer, etc.) relative to the bonds dollar price and all market alternatives and also relative to where Stamper determines we are in the credit cycle (please see www.risk-adjusted.com for more information). Stamper has used many strategies to implement the upside potential/downside protection methodology over the past twenty years that have resulted in fortuitous sector rotation, category/box switching, and individual credit and security selection, etc. We believe that active management and a wide-open investment mandate combined with workable strategies, focus and implementation can be most effective – in this analysis it certainly seems to be.
Conclusion – We at Stamper Capital & Investments, Inc. think this analysis fairly demonstrates that we achieved our goal: to provide superior risk-adjusted performance across the entire municipal bond market for our clients. Importantly, we have achieved similar, if not superior, performance for our High Net Worth Private Accounts.
Our other goals at Stamper Capital are to give our clients superior service, to have superior systems and to make superior forecasts. Please read our January 2010 Annual Forecast. If you or your clients are interested in Stamper’s High Net Worth Separately Managed Accounts management, please visit our High Net Worth Accounts section of our website for more information.
Appendix
Definitions:
Total Return: The actual return on an investment. This includes income earned on an investment as well as appreciation or depreciation of that investment. In this article, we report total return on funds before expenses are deducted. This is in order to show actual performance of the Portfolio Manager before the fund administration and other fees handicap performance.
Standard Deviation: A measure of risk. The higher the Standard Deviation, the more fund performance varies from its mean monthly total return over the respective period, which in this case, is over the prior 10 years. The higher the Standard Deviation, the higher the risk.
Risk-Free Rate: In this article, we use the 90-Day US T-Bill average yield for the 3, 5, and 10 year periods after taxes of 35% are deducted. This is because all of the funds we are using for comparison are federal tax-free. If a high net worth investor were to put their money into a T-Bill instead of VMPAX, they would have to pay a 35% tax, whereas had they been invested in VMPAX, that would not apply.
Mutual Fund Categories: When defining competing funds into their respective categories, we used their own definitions of their respective funds. This is mainly because all of their prospectuses may have different guidelines. Below is a table showing the number of funds in each category. For the time-period the data was compiled, VMPAX was classified in the short category, but this has varied over the years.
|
|
3-Year |
5-Year |
10-Year |
|
Short |
24 |
23 |
17 |
|
Intermediate |
52 |
51 |
46 |
|
Long |
53 |
53 |
53 |
|
High yield |
25 |
23 |
21 |
Additional Graphical Analysis:
Stamper Capital & Investments, Inc. manages the Evergreen Strategic Municipal Fund (VMPAX) with wide-open prospectus guidelines that allow the portfolio manager, B. Clark Stamper, to tailor holdings to align with his current market analysis and forecasts. (See examples in the Annual Forecasts and Articles section on our website, www.risk-adjusted.com, for more information) By having the flexibility to control virtually every nuance of the portfolio, Stamper is able to produce a high level of return for a low level of risk when compared to virtually all municipal bond fund categories, including High Yield, Short, Intermediate, and Long. The only open-ended U.S. tax-free mutual funds excluded from this analysis are money market funds, ultra short funds (which have duration of 1.5 years or less), and single state tax-free municipal bond funds. The Evergreen Strategic Municipal Bond Fund defies placement in any category, because it competes against them all.

Each point on these graphs represents a competing Municipal Bond Fund and their respective categories. **In the above scatter plot graph, the X-axis shows the Standard Deviation of each fund in relation to it’s own performance. ***The Y-axis contains the 10-Year Annualized Total Return for the month end of 5-31-2009. The Total Return data uses gross total return (return before expenses are deducted).
Points located closer to the upper left have the most return for the least amount of risk taken, and points closer to the lower right have the least return for the most amount of risk taken. The lines extending from the risk-free rate of return delineate the quality of performance the funds contained within have shown for the respective period. Points located below the lowest line have the worst performance. Points just above that line and below the center line have middling performance. Points above the center line are top performers, and any points located above the uppermost line have superior risk-adjusted performance.
In the 10-Year graph above, 137 funds are represented, and you can see the Evergreen Strategic Municipal Bond Fund stands out as a large blue point. Note the position of this point is very close to the Y-axis, indicating low deviation from its mean total return. In fact, the 10-Year Standard Deviation for this fund is lower than 93% of all Muni Funds across all categories, at the same time producing a 4.52% Gross Total Return. That means that Stamper was able to create 4.52% Gross Total Return taking less risk than 127 other Portfolio Managers!
The graph shows that the VMPAX has superior risk-adjusted performance in relation to the vast majority of Muni Funds across all categories over a 10-year period ending 5-31-2009. This can also be seen in the 5-Year and 3-Year graphs below.
The VMPAX had lower Standard Deviation, or risk, than 97% of funds in all categories over the 5-Year period, and still returned 4.23%! The 5-year graph represents 150 competing funds, and Stamper took less risk than 145 of them.
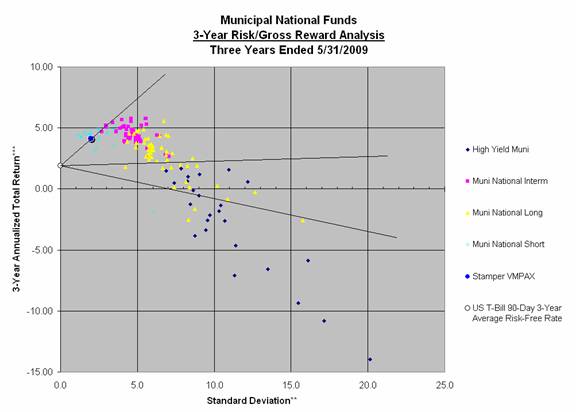
The 3-Year graph also shows superior risk-adjusted performance, returning 4.12% with a lower Standard Deviation than 94% of all funds in all categories. This graph represents 154 funds, and Stamper beat 144 on a risk basis of comparison.
The next series of graphs show the performance of the Evergreen Strategic Municipal Bond Fund versus individual categories for 3, 5, and 10 year periods ending 5-31-2009. These categories include Short, Intermediate, Long, and High Yield. Note that while Stamper is able to beat these categories on a risk-adjusted basis, which may not be the same strategy that the portfolio managers of other funds use.
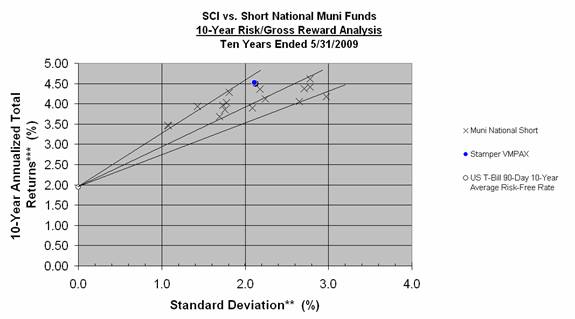
The VMPAX had lower Standard Deviation (risk) than 41% of funds in the short category over the 10-Year period, but still returned 4.52%, higher than 88% of all short-term funds.
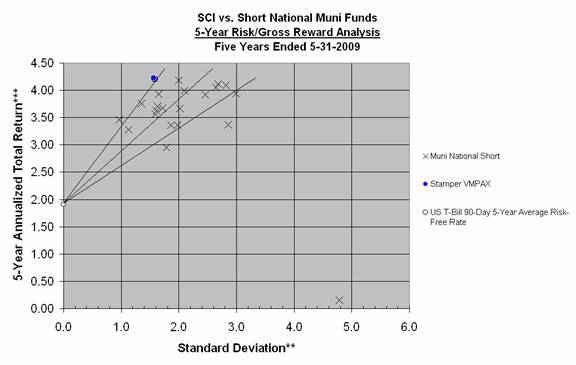
Over the 5-year period, when compared to all funds in short term category, the VMPAX had lower Standard Deviation, or risk, than 78% of funds in the short category over the 5-Year period, but still returned 4.23%, outperforming 100% of all other short-term funds with very low risk! This category consists of 23 funds, including VMPAX.
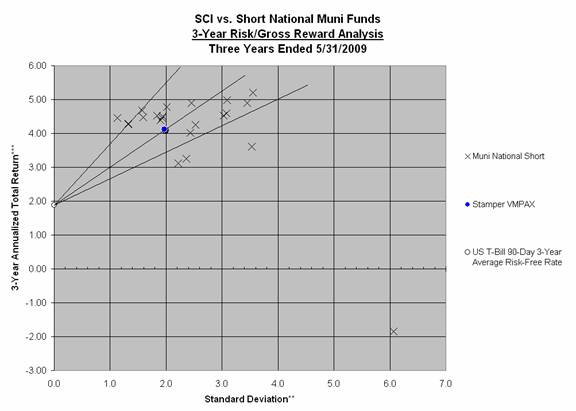
Stamper was in the middle of the pack for the 3-year period, and had lower Standard Deviation, or risk, than 58% of funds, and returned 4.12%, which beat 21% of all short funds. This category consists of 24 competing funds.
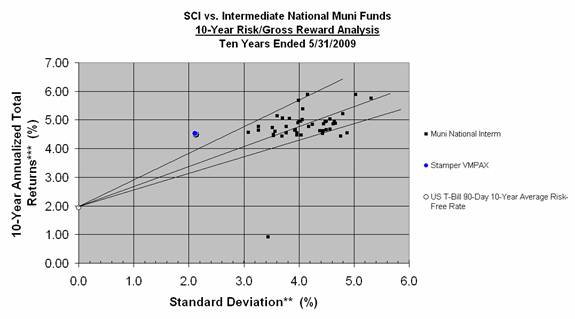
In the 10-Year period of the Intermediate category, competing against 47 funds, Stamper had the lowest Standard Deviation of them all, and returned 4.52%, as a top performer, when compared to the intermediates on a risk-adjusted basis.
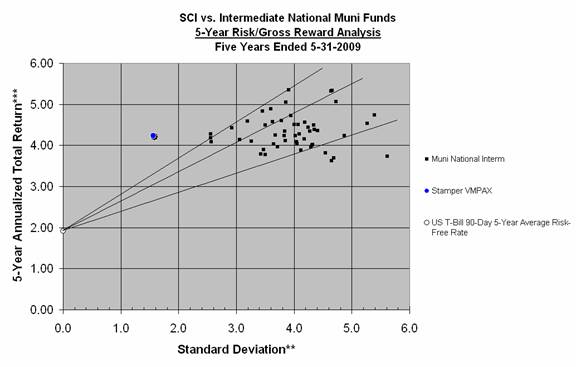
The VMPAX had lower Standard Deviation, or risk, than 100% of competing funds in the Intermediate category over the 5-Year period, and still returned 4.23%! The 5-year graph represents 52 competing funds, and Stamper took less risk than all of them while maintaining a position in the superior risk-adjusted section of the graph.
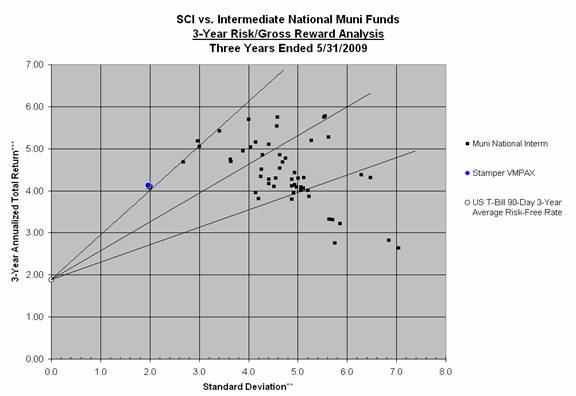
This 3-Year Intermediate category graph also shows superior risk-adjusted performance, returning 4.12% with a lower Standard Deviation than 100% of all intermediate funds. This graph represents 54 funds.
Stamper period had lower Standard Deviation, or risk, than 100% of long-term funds for the 10-year, and returned 4.52%. This category consists of 53 funds.
The VMPAX had lower Standard Deviation, or risk, than 100% of other funds in the long term category over the 5-Year period, and still returned 4.23%, which beats 56% of the competition. The 5-year graph represents 53 competing funds plus VMPAX for 54 total, and Stamper took less risk than all of them.

Over the 3-year period, when compared to all funds in long-term category, the VMPAX had lower Standard Deviation, or risk, than all other funds in the category and still returned 4.12%, higher than 78% of the competition.
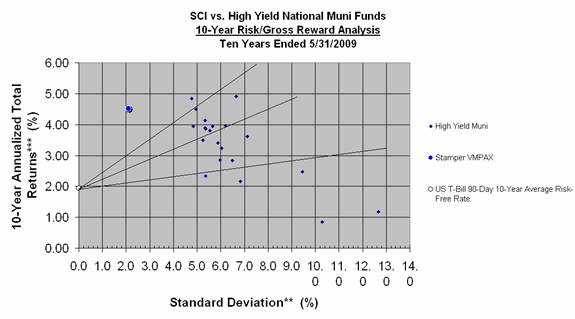
The Stamper manager Strategic Muni Fund not only had lower Standard Deviation than all High Yield Category funds, but it also beat out 86% of them with a Gross Total Return of 4.52%, and that’s with significantly less risk!
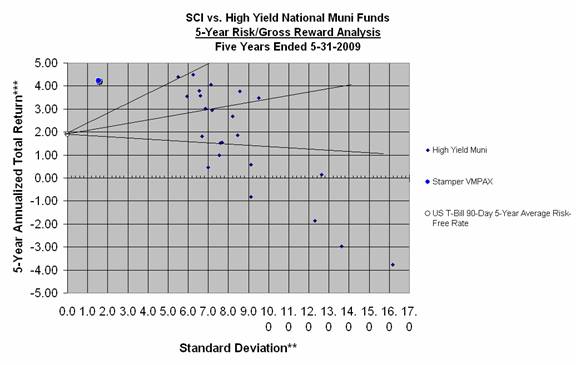
The 5-Year High Yield Category took significantly more risk for a lot less reward as a whole than the Stamper run VMPAX. Of the 23 funds in the High Yield 5-Year category, Stamper earned 4.23% while taking less risk than 100% of the competition.
In this graph, you can quickly see how the Stamper managed fund wallops 100% of the High-Yield Funds in risk and return without a single competitor coming anywhere close.
Stamper Capital & Investments strategy is to target superior risk-adjusted performance across all levels of competition using upside potential/downside protection methodology, as has been demonstrated here. To learn more about how our Portfolio Manager, B. Clark Stamper accomplishes this, please see our website, www.risk-adjusted.com which describes in length his Market Commentaries and Forecasts, as well as his background information (see Portfolio Manager Resume and our Articles sections). The upside potential/downside protection model has worked well in all of these categories. Our Annual January Forecasts are based on this methodology. We believe that they have been more accurate than most forecasters.
Please read our January 2010 Annual Forecast. Anyone interested in Separately Managed Accounts with Stamper Capital & Investments, Inc., can refer to our High Net Worth Accounts section of our website for more information.
Stamper Capital & Investments, Inc. provides portfolio management services exclusively for institutional and high net worth accounts and does not sell the mutual funds for which it is a sub-adviser. Also, please note: purchasers of mutual funds must receive a copy of a particular mutual fund's prospectus before a purchase is made.
Stamper Capital & Investments, Inc. has been the sub-adviser to this Fund since October 1995 and B. Clark Stamper, our President, has been its Portfolio Manager since June 1990.
Past performance does not guarantee future results, and current performance may be higher or lower than the performance data quoted. Investment return and principal value of an investment will fluctuate so that investor's shares, when redeemed, may be worth more or less than their original cost.
Returns - Figures quoted are gross total returns calculated for the share class and time periods shown. Performance includes the reinvestment of income dividends and capital gains distributions. Performance does not reflect the deduction of taxes that a shareholder would pay on a fund distribution or the redemption of fund shares. Please see the Disclaimer link on the bottom left of this page for more information about risk and return.